Forum Replies Created
-
AuthorPosts
-
support
KeymasterHi,
Sorry for the confusion. The “diagnostics” page is shown in the “Live Profiling” window, not “Ream-time watch”.
Based on your last description, it looks like something is interfering with the instruction counter used by VisualGDB. Please try disabling the Chronometer (normally it should be disabled automatically when doing profiling or real-time watch). If it doesn’t help, your device may block the software from resetting the instruction count register (e.g. STM32F7 devices have this issue). In this case you would need to use a general-purpose timer instead (we have a detailed tutorial showing how to do that).
KeymasterHi,
Normally the –start-group and –end-group arguments should handle this automatically – force the linker to automatically reorder the libraries between those 2 statements. Perhaps you are using some very old version of the linker that doesn’t handle it properly? If this is the case, simply updating it may solve the problem.
If this doesn’t help, could you confirm that specifying -ludev just before –end-group still causes the problem?
KeymasterHi,
Normally printf() should work. E.g. below is the output from the “Hello, World” sample project created by VisualGDB with no further modifications:
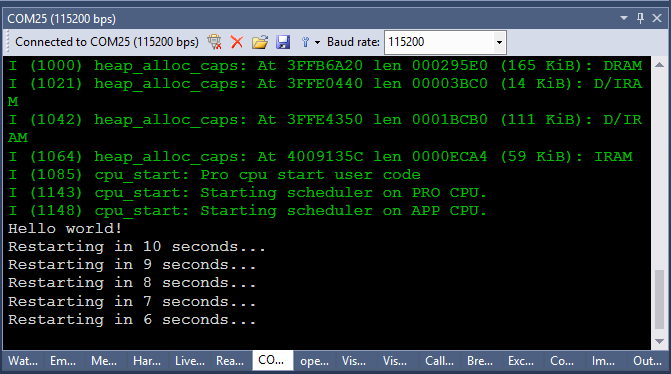
If you don’t see the green “cpu_start” text, your program might not be launching properly. We actually have a detailed tutorial on diagnosing ESP32 startup issues here: https://visualgdb.com/tutorials/esp32/flashdiag/. Please feel free to follow it and let us know if you have any further questions.
Attachments:
You must be logged in to view attached files.KeymasterHi,
VisualGDB always shows full paths on the IntelliSense Directories page and substitutes various internally used variables there. The actual .vcxproj file should actually contain relative paths. You can check this via VS (not VisualGDB) project properties or by looking into the .vcxproj file directly.
KeymasterHi,
The attached template file is indeed broken (has contents inside a subdirectory). To troubleshoot this type or problems please try creating a new template, rename it to .zip and compare its contents with your edited template side-by-side.
KeymasterHi,
Thanks, looks like our bug. Please try this build: http://sysprogs.com/files/tmp/VisualGDB-5.3.16.1925.msi
KeymasterHi,
We have managed to reproduce the problem from the template file you attached in another thread and it looks like the the problem is caused by the extra comma after some arguments in your command line, e.g.:
-Wl,--defsym,_stack=0x20006000,
should be
-Wl,--defsym,_stack=0x20006000
We agree that the error message shown by gcc is not very informative and extremely cryptic, although it would be beyond our capacity to maintain and ship a special fork of GCC resolving such issues. Our best advice would be to try contacting the GCC mailing lists to see if anyone there is willing to fix this.
KeymasterHi,
The About window would indeed not be shown if the trial had expired, and various other VisualGDB commands and components (e.g. responsible for launching OpenOCD) would not work either.
We usually give a trial extension voucher to help our prospective customers resolve the issues that were not resolved during the normal trial period so that they could decide whether the product works for them. As you have activated the extension voucher on a different machine, it got flagged as redeemed and would not work the second time. If VisualGDB works without any problems on the other machine, most likely either some tools on your home computer are corrupt, or the problems are caused by the expired trial.
KeymasterHi,
We usually only issue one trial extension per person and the same trial extension voucher would not activate on multiple machines.
KeymasterHi,
We would advise trying to minimize both command lines as long as they still produce different results.
E.g. try removing all .o files from the opencm3 command line and check if you get the same cryptic error or an actual “missing entry point” error. If the message is still cryptic, try replacing the linker script with the normal linker script and if it doesn’t change anything, try removing other options.
KeymasterThe RSP file looks OK. As a quick check, could you try creating a new “LEDBlink” project with the same toolchain? If it doesn’t work, please try reinstalling the toolchain.
If it does, please try comparing both RSP files.
KeymasterHi,
Thanks for the build log. Unfortunately it looks like an error that happens before the Linker manages to output enough information.
Please try locating the Release\Debug\<ProjectName>.link.rsp file and post its content here (please also attach your <mcu>.props file from the project directory). The file should contain the linker command line and should help us see what could be wrong.
If you see something suspicious in the file, please try running the following command from the project directory:
<full path to arm-eabi-gcc> @Release\Debug\<ProjectName>.link.rsp
If you can reproduce the same error, try removing the suspicious part and run GCC again. If you can successfully pinpoint a part that is causing an error, please edit your settings accordingly.
KeymasterHi,
No problem, we can walk you through diagnosing this. Please try setting a breakpoint in ReportFunctionRunTimeToRealtimeWatch() in the profiler framework.
Does the function get invoked? Does the rec.Address expression match the instrumented function address (the least significant bit will be 1 to signify the THUMB code)?
If yes, please try running a regular instrumenting profiler session and switch Live Profiling window to “Diagnostics”. It should show various statistical data (e.g. buffer utilization, samples/second, bytes received). Please attach a screenshot of the diagnostic data here (or simply list all the numbers) so that we can see what is going on.
KeymasterHi,
It looks like something in the linker command line is broken. Please try enabling verbose mode via VS Project Properties -> Linker -> Advanced (not the regular VisualGDB verbose mode) and post the entire verbose build output here so that we could help you understand what is going on.
KeymasterHi,
We actually have a HAL tutorial here: https://visualgdb.com/tutorials/arm/stm32/uart/hal/
Please try following it instead.
-
AuthorPosts