One of the features most wanted from VisualGDB before version 5.2 was to detect stack overflows on embedded devices. On a typical ARM Cortex microcontroller where every byte counts, running out of stack space is not something out of the ordinary, and it can have catastrophic consequences and be hard to debug. So VisualGDB 5.2 Preview 2 comes with a feature that makes the stack usage analysis completely automatic and tracks the overflow event when it happens: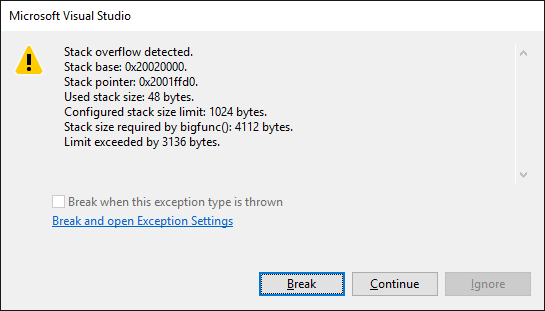 Continue reading Introducing Dynamic Stack Verifier
Monthly Archives: August 2016
Extending Real-time Watch with Custom Events
The new Visual Watch feature in VisualGDB 5.2 helps quickly visualize the timings of RTOS threads and functions, but what should you do if you want to track something more fine-grain? Thankfully the answer is really simple and I will show you why in just a moment.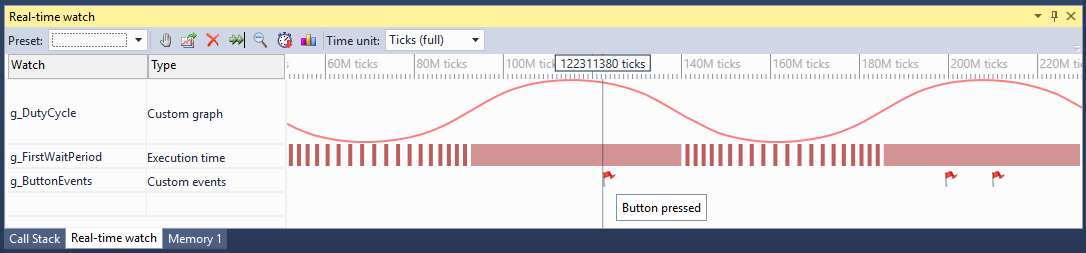 Continue reading Extending Real-time Watch with Custom Events
Introducing the new Real-time Watch
One of the toughest types of problems faced by embedded software developers is timing problems. Seeing what exactly happened before a problem popped up and being able to put multiple events on one scale could save hours of time. The previous version of VisualGDB included an embedded profiler that could collect statistics on the runtime of various functions. VisualGDB 5.2 takes this even further and introduces Real-time watch – a framework for convenient recording and visualization of various real-time events in your program that works out-of-the-box with FreeRTOS and supports non-RTOS environments as well: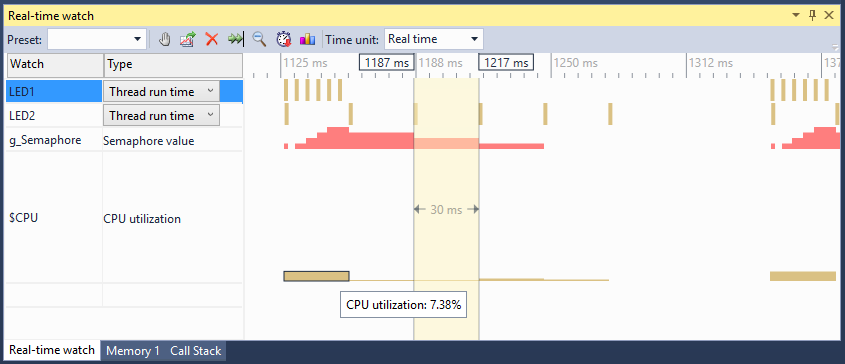
Clang IntelliSense improvements in VisualGDB 5.2
The upcoming VisualGDB 5.2 comes with several improvements to the Clang IntelliSense engine that make the development experience easier and save time on common tasks. Let’s look at those in detail.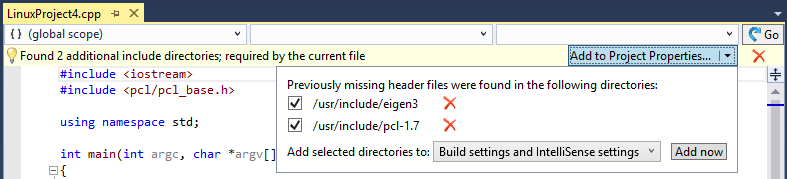 Continue reading Clang IntelliSense improvements in VisualGDB 5.2