Today is the day! We have ported a minimally usable subset of VisualGDB to our cross-platform CodeVROOM IDE. You can now create ARM-based embedded projects on Windows, Linux and MacOS using the VisualGDB’s CMake engine: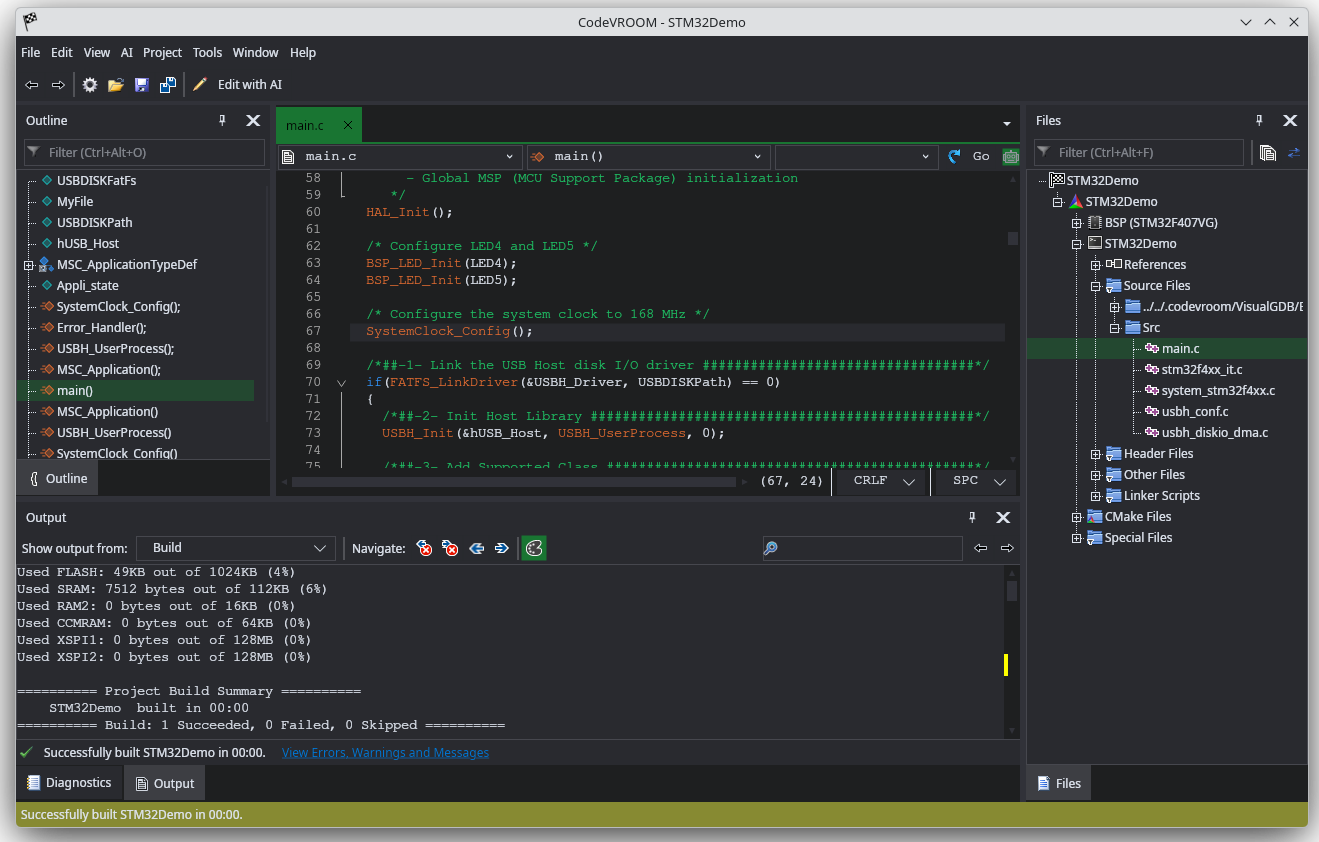 This is still a very early development preview. A lot of GUI is still missing, debugging is not there yet, but the code completion and navigation work just fine.
All posts by Ivan Shcherbakov
VisualGDB 6.1 Is Out
Good news, everyone. VisualGDB 6.1 is out of beta.
The main highlight of the release is the new AI-driven editing and refactoring engine, specifically designed for large C/C++ projects.
VisualGDB 6.1 Beta 5 is out!
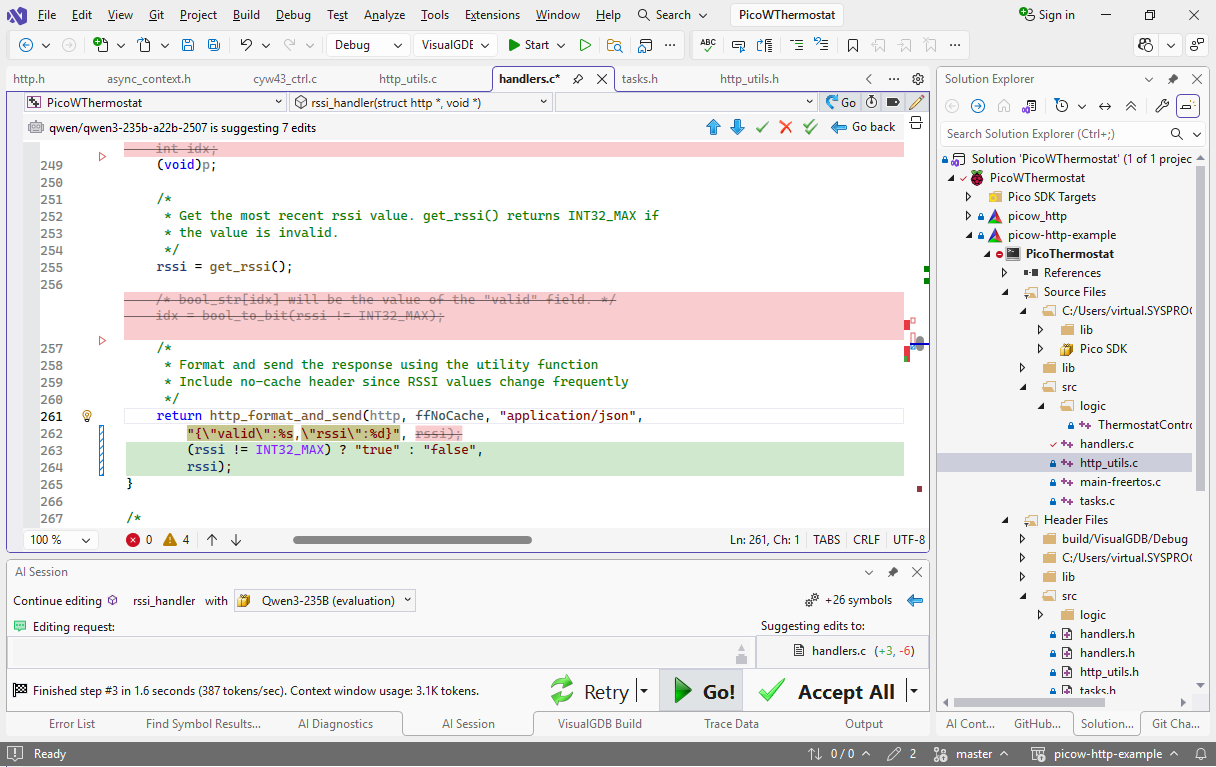
We have just released VisualGDB 6.1 Beta 5 introducing our new fast AI editing engine: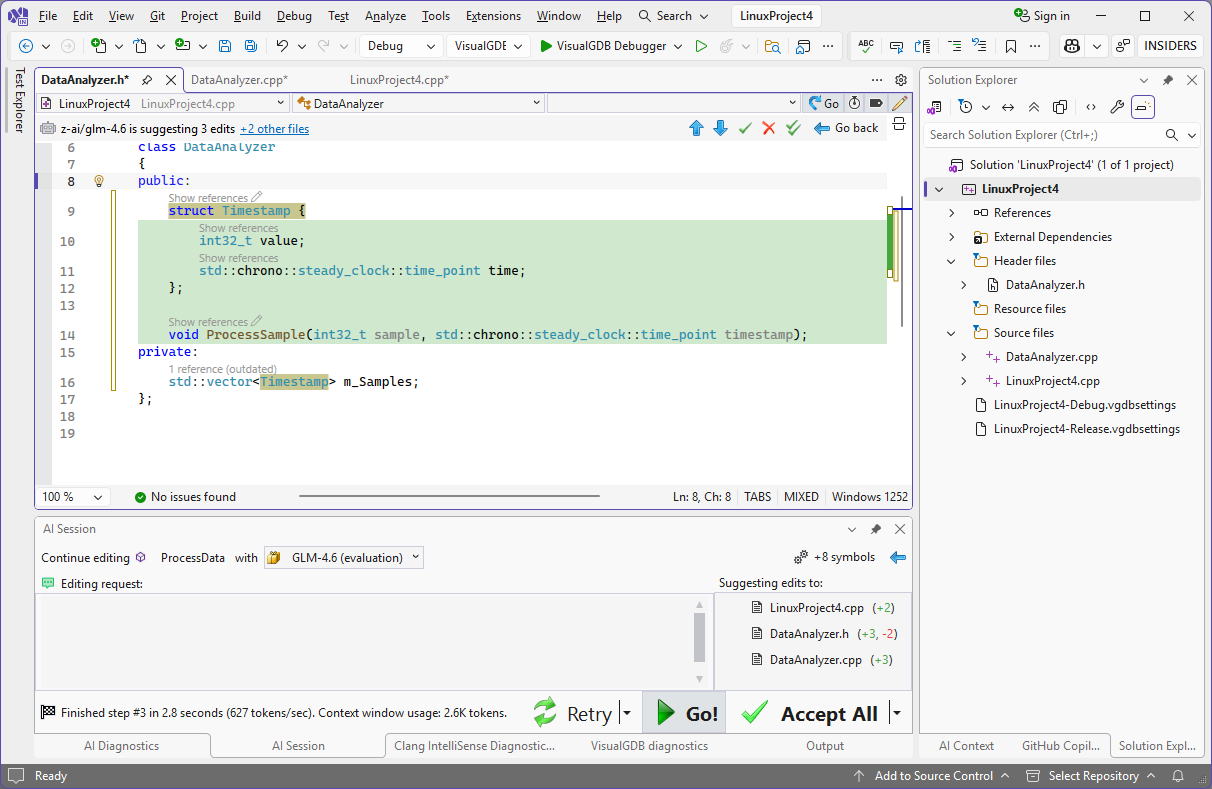
You can now do many simple code edits on a much higher level, without having to think about every declaration. Point at code, give brief instructions like “store timestamps along with ADC values” and get to reviewing proposed edits in a matter of seconds.
You can download the new version here, or read more about the new AI engine on this page.
VisualGDB 6.1 Beta 1 is out
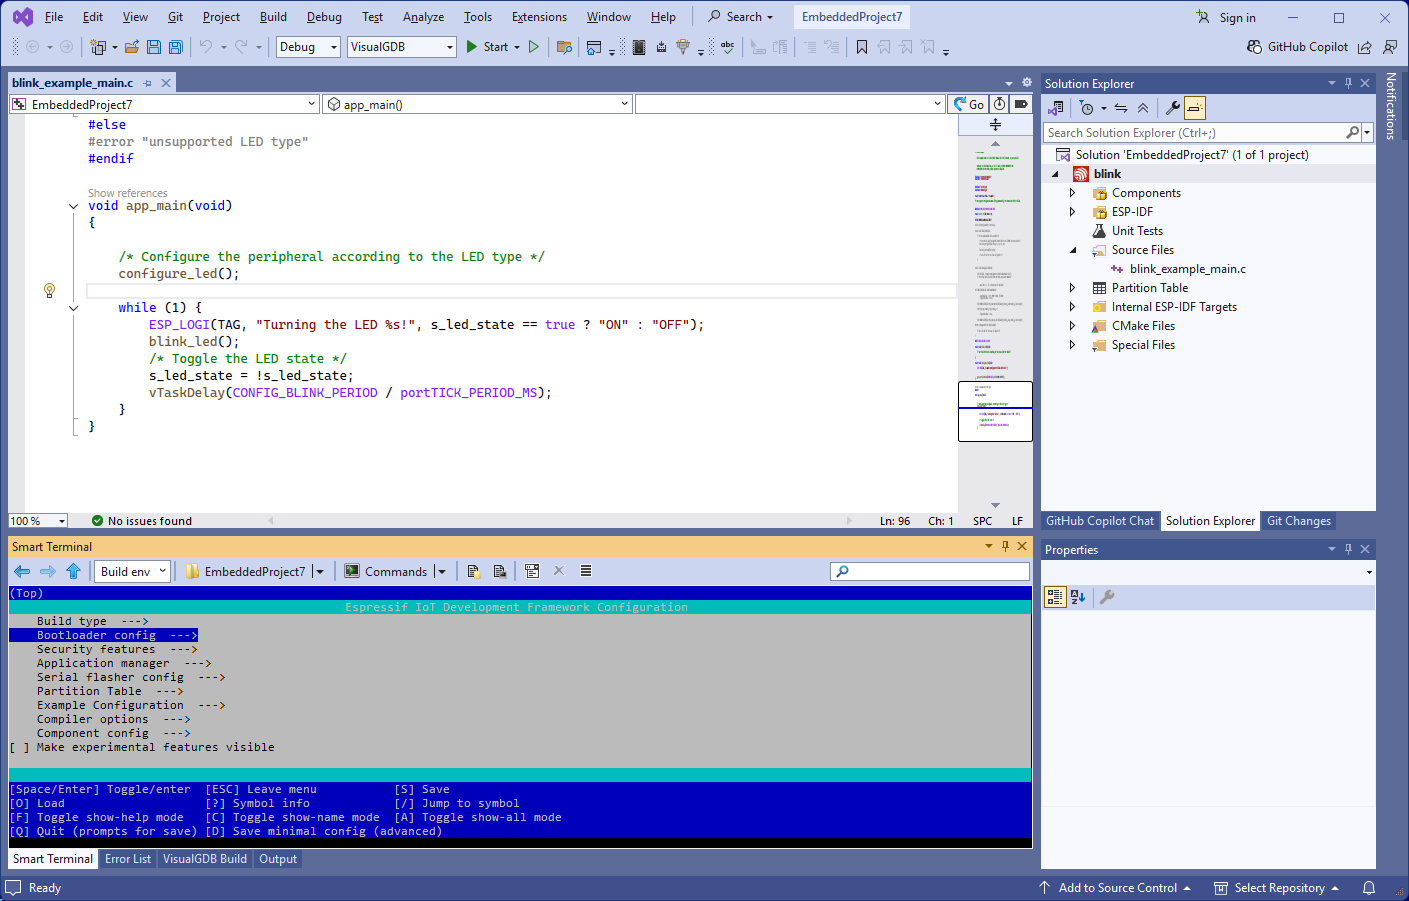
Today we have released the first Beta of VisualGDB 6.1. It introduces the new Smart Terminal GUI for all project types, considerably improves the ESP-IDF workflow with the new Consolidated Toolchain, and introduces a few smaller features like Live Watch on Linux, and better GUI for editing CMake file lists.
How we use AI to Develop VisualGDB Features
When someone says “AI” or “Vibe Coding”, they usually imply a small hobby project, or, at best a landing page. But when it comes to larger projects, LLMs are known to get stuck on a wrong path, hallucinate, and overall not be very useful. Well, today I’ll show you how sticking to short focused prompts, and switching back and forth between insightful Anthropic Claude and a lightning-fast Llama 4 significantly reduced the coding effort for adding a small feature to a big C# project with a 13-year-old code base:
Continue reading How we use AI to Develop VisualGDB Features
VisualGDB 6.0R5 is out
Good news, everyone! We have finished integrating VisualGDB with SourceVu, so you can now easily view online documentation and examples for commonly used functions by just pressing F1 in Visual Studio, or clicking at the SourceVu link at the bottom of the quick info tooltips:
 To use the new functionality, update to VisualGDB 6.0R5 and you are all set! As a bonus, the new build fixes a few glitches with the high-DPI displays, adds support for the latest VS preview, and introduces various other fixes across the board.
Introducing SourceVu
Have you ever opened an old project that used to work just fine, only to find out that you can’t build it anymore because it relies on some pieces that got removed from the latest SDK? Ever tried to understand code in a text editor without full context? Where searching for “Status” can give you 20 different definitions, and good luck figuring out which exact one is referenced right here?
I used to run into these problems all the time and I know the pain. So that’s why today we are introducing SourceVu – a browser-based source navigation system that can make a snapshot of your project, capturing references, call trees, instances of all the classes and structs, and let you revisit it later, with full IDE-like navigation.
It now contains pre-indexed versions of two popular embedded frameworks – STM32 SDKs and the Raspberry Pi Pico SDK. Want to find all samples using HAL_UART_Transmit_IT()? One click, and you are there. Want to quickly look up what dhcp_discover() is supposed to do, with a bird’s eye view of the call tree and variables it modifies? Another click and here you go.
SourceVu integration is coming into future versions of VisualGDB, with support for running your own servers and exporting your projects into archives that can be viewed at any time with nothing else than just a browser.
VisualGDB 6.0 is out of Beta
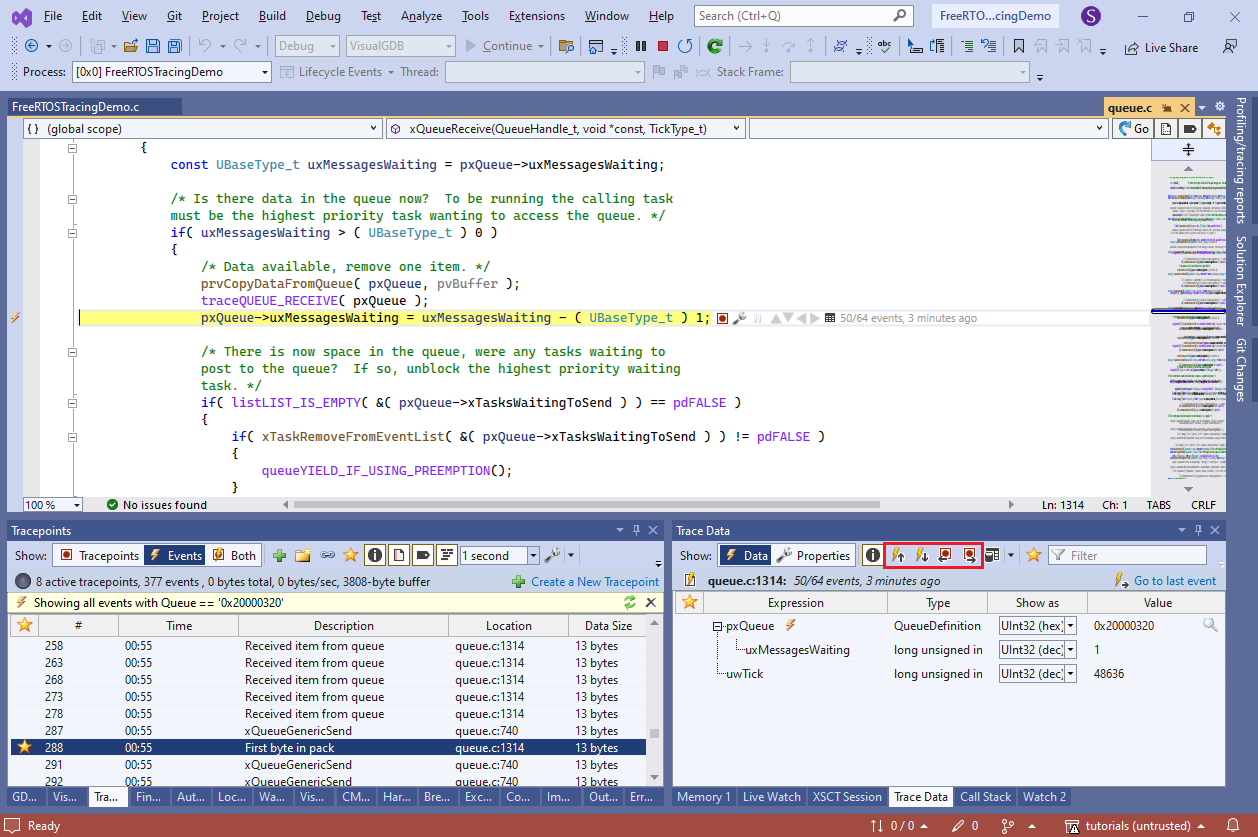
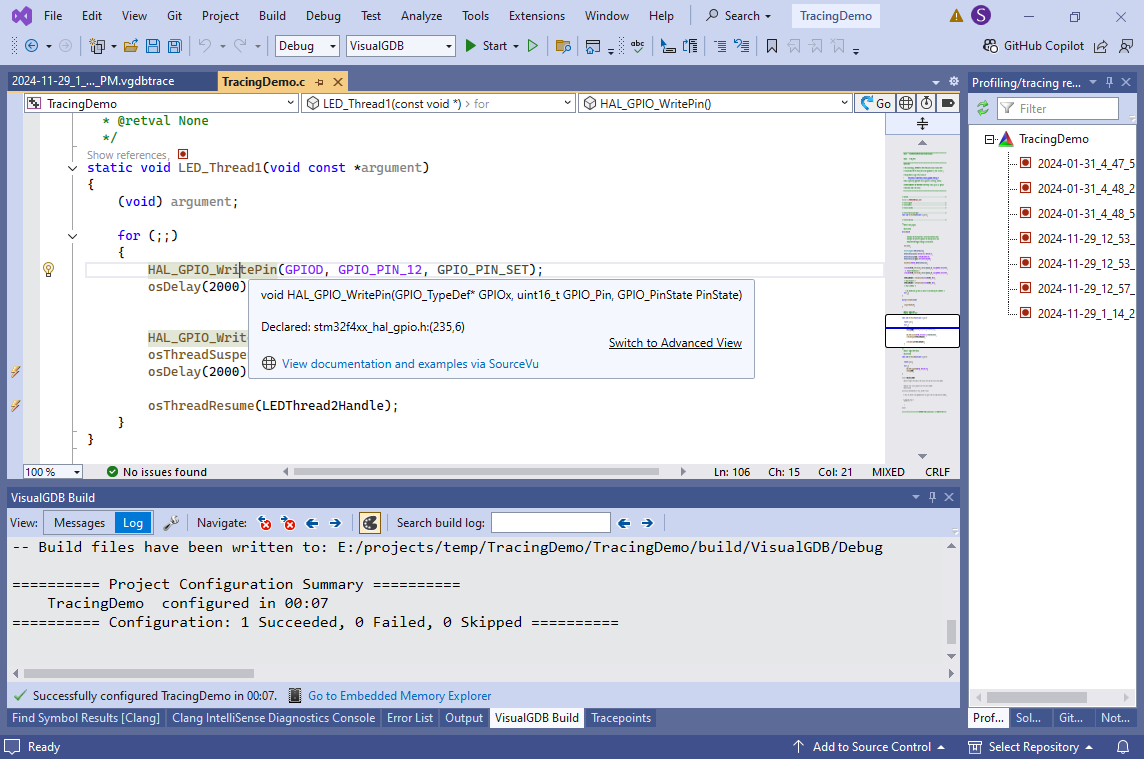
Today we are happy to announce the stable release of VisualGDB 6.0. If you haven’t tried the Beta releases yet, the biggest feature to check out would be the new Tracing Engine.
It allows placing tracepoints anywhere in the embedded code that will record the data you selected, with minimal disruptions to the program flow: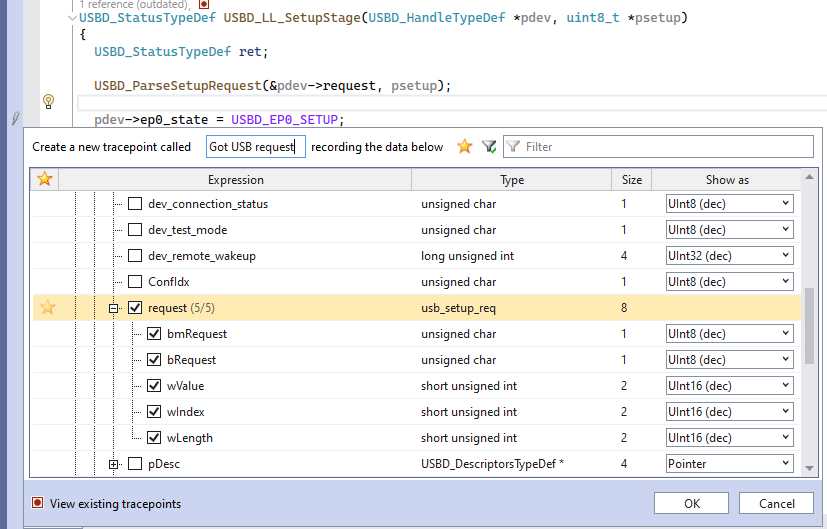 Tracepoints run directly on the target and store the collected data in a circular buffer inside the device’s memory, so they are not affected by JTAG latency, and generally run very fast.
You can step through the recorded events while the program is still running, or save them into a report file, and review it later: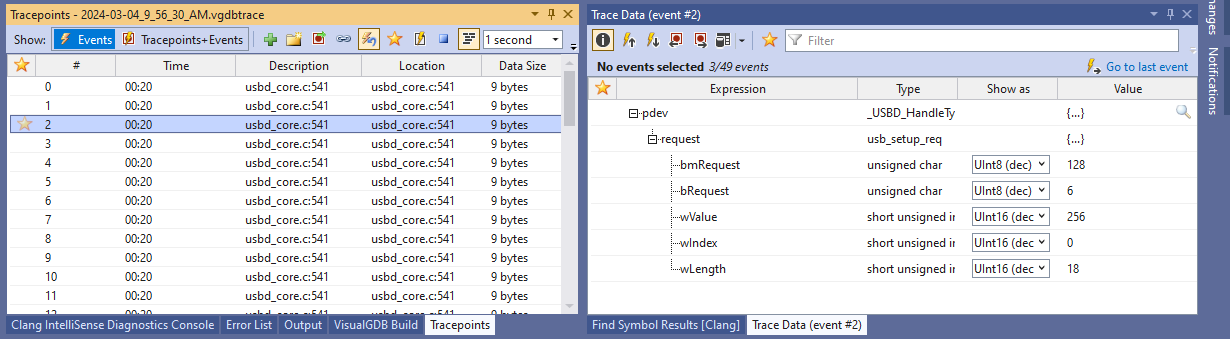 Tracing makes it easy to debug real-time code where stopping the target even for a few milliseconds is not acceptable. Think logging USB requests, recording DMA state at different stages of signal generation, storing every sample coming from an ADC, logging every thread switch, etc.
You can find various tutorials on software tracing here, and more are on the way!
If you have already tried the Betas, the final 6.0 release brings numerous usability improvements to tracing: you can now format pointers values as [nearest symbol + offset], record void * variables as dynamically-sized byte arrays, properly format IP addresses, dump multiple trace events into easy-to-read text files, or convert the trace reports into a machine-readable XML format.
Other v6.0 changes include a newer IntelliSense engine based on Clang 16.0, full support for ARM64 hosts (e.g. Macbook), Unlimited FLASH breakpoints on STM32 with OpenOCD, and numerous other fixes and usability improvements.
Try it out
You can download VisualGDB 6.0 here or use the VisualGDB Package Manager to update from an older version. If you have any questions or suggestions about the new release, do not hesitate to reach out to us.
Announcing VisualGDB 6.0 Beta 4
Today we are happy to announce the last Beta of VisualGDB 6.0 before the final release. It features a new navigation bar packed with usability features, better dark theme integration, out-of-the-box support for ARM64 hosts and much more.
Announcing VisualGDB 6.0 Beta 2
Today we have released VisualGDB 6.0 Beta 2, featuring numerous improvements to the Live Tracing system and other parts. In this post I will give you an overview of them.