Today we have released VisualGDB 6.0 Beta 2, featuring numerous improvements to the Live Tracing system and other parts. In this post I will give you an overview of them.
Easier Live Tracing GUI
If you wanted to trace your embedded project with VisualGDB 6.0 Beta 1, you would need to manually locate the vector table symbol and choose how to reserve the trace memory. It is not much, but it’s an extra distraction if all you want to do is see why your firmware is not behaving. The new Beta 2 does it automatically for most common project types. Just enable tracing in the wizard and you are good to go: 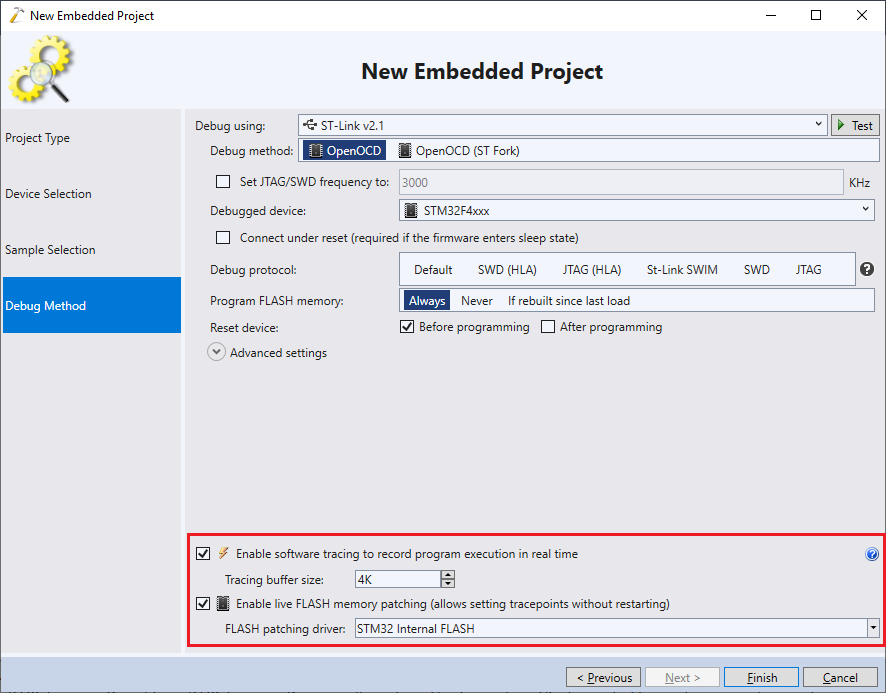 The Software Tracing property page is now also much simpler: you can select the trace buffer size, optimization mode, verify that its placement make sense and normally won’t need to touch anything else:
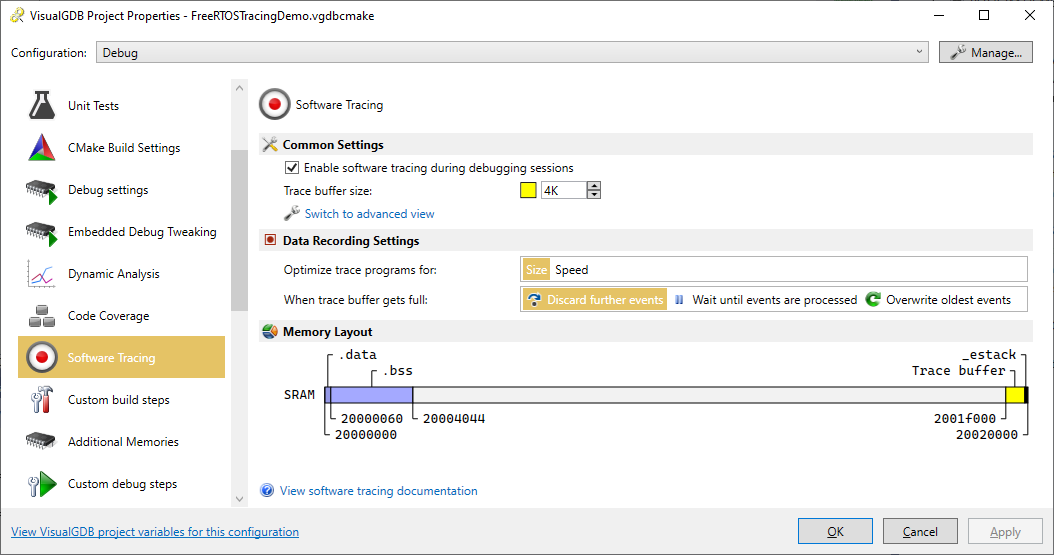 The advanced tracing settings are still available under the Advanced view, but we made sure they are auto-detected correctly for the most common project types (STM32, MCUXpresso, Mbed, NRFConnect, STM32 Arduino, etc).
Unlimited FLASH Breakpoints and Dynamic Tracepoints
If you were using Segger J-Link before, you could set any number of breakpoints in FLASH memory without having to think about it. However, OpenOCD with ST-Link was a different story with a limited number of hardware breakpoints.
VisualGDB 6.0 Beta 2 addresses it by introducing a new FLASH Patcher framework – a system of plugins that can load on top of your application, patch the FLASH memory as needed, and restore the old state. It works out-of-the-box for STM32 devices, providing unlimited breakpoints, and allowing you to add and remove tracepoints in the FLASH memory without restarting. Support for more devices is coming soon.
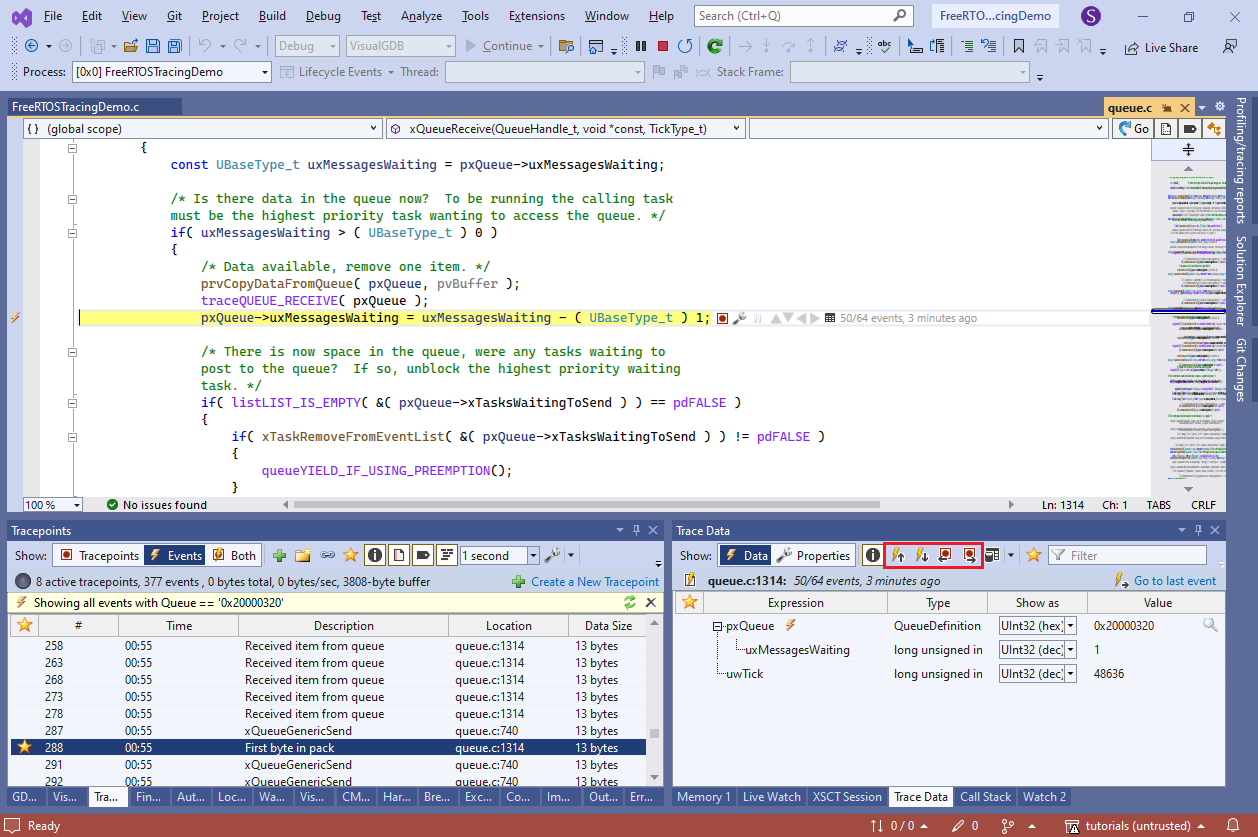
More Tracing Modes
You can now use Live Tracing in blocking mode (i.e. wait until all trace output is processed) to record heavy bursts of events (e.g. all USB packets), or circular mode (where only the last events are saved) to analyze what happened directly before a crash.
You can now also trace hardware registers (e.g. DMA pointers, status registers, etc) and the Cortex-M DWT cycle counter (which is now auto-extended to 64 bits and doesn’t interfere with the Chrohometer) to record the precise timing of your code.
Tracing programs (generated instructions that save the traced data) can now be optimized for size or speed. When optimizing for size, VisualGDB will detect and aggressively fold repeating sequences (e.g. tracing 16 consecutive words will be done in 1 loop vs. 16 separate load + store pairs).
Quick Debug Tracing
You can use VisualGDB to trace executables built anywhere else with Quick Debug. Simply enable the tracing checkbox, and VisualGDB will automatically patch the executable to record the data you want, without the need to rebuild it or change any source code.
Command Line Tracing
You can now generate trace reports (both browseable with Visual Studio and machine-readable XML) via command line. This is particularly useful for unit tests – additionally to the usual passed/failed table, you can now have a detailed recording of all called functions (with values), thread switch events, or anything else that you would want to compare against a future version later.
Give It a Try
VisualGDB 6.0 Beta 2 includes several other improvements and fixes. We have added support for multiple symbol files per debug session, fixed Live Coverage support on GCC 12.x, improved integration with the latest ARMClang, and much more. You can download the new release on the download page. If you have any feedback, don’t hesitate to reach us out via our support form or the VisualGDB forum.