One of the toughest things about debugging embedded systems is that setting a breakpoint isn’t always an option. Sometimes, you don’t know where exactly the problem is until everything crashes. Sometimes, you cannot pause your device for a couple of seconds because it’s continuously talking to other parts of the system. Even if you can, good luck finding that inconsistency among 100 USB packets handled by your device within the past second.
VisualGDB 6.0 fixes this once and for all with the new software-based Live Tracing – a mechanism for setting tracepoints and recording what exactly the application is doing without having to stop it: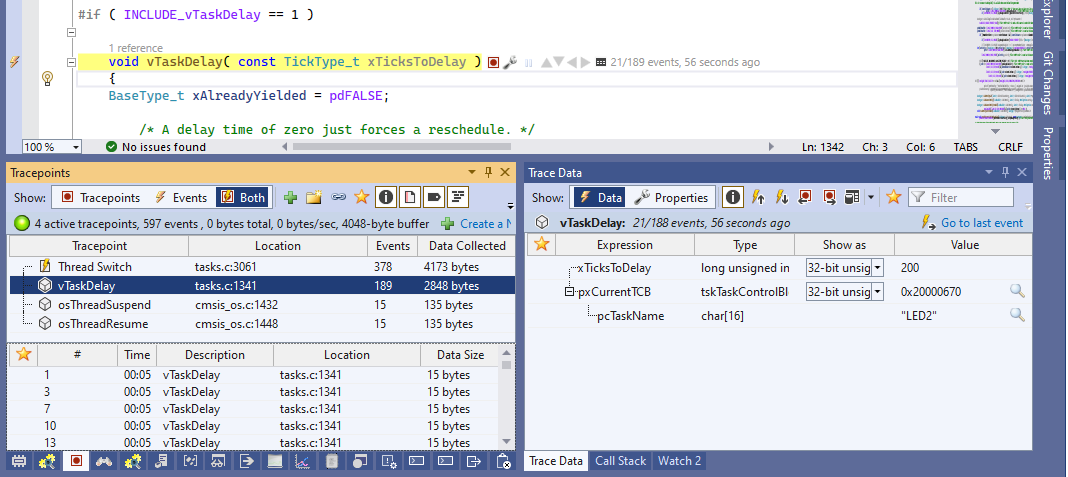
Tracing of embedded systems isn’t a completely new concept. You could previously obtain an instruction-level trace of your code with J-Trace. You could visualize various FreeRTOS events with Real-time watch. You could even write code to report your own events to the Real-time watch GUI.
The problem with all these methods is the non-trivial setup they need. J-Trace requires special wiring and doesn’t show data. Real-time watch relies on special tracing macros, and reporting custom events needs writing extra code, that would need to be removed once the problem is found.
Live Tracing lets you skip all the inconvenience and record what the program is doing with a few mouse clicks. Point to any location in the code. Select which variables to trace. Done! VisualGDB will take care of the rest – figure out where in memory they are stored, patch the program to record them, and present the results to you in a convenient form: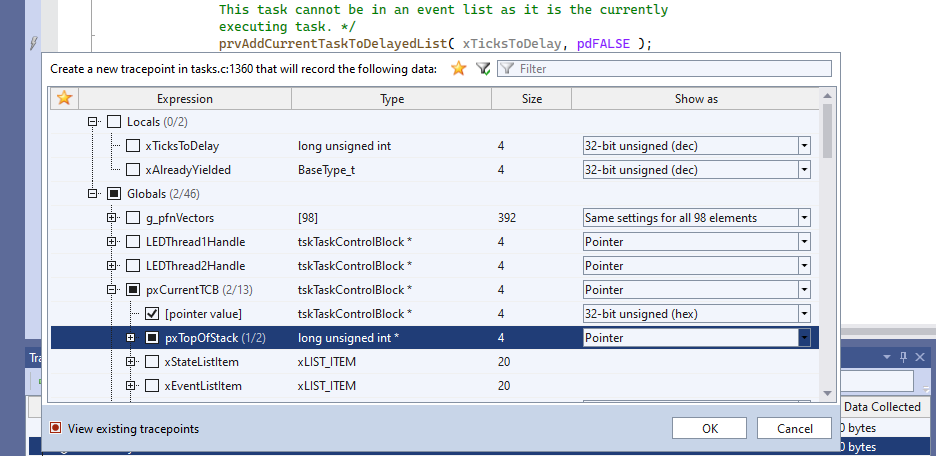 Live Tracing works on existing ELF files and does not require linking the application with any frameworks. It has been tested with STM32Cube, nRFConnect, MCUXpresso and MBED frameworks and more targets are coming soon.
Want to see all context switches, and what the stack pointers were? You are a few clicks away.
Want to plot the ADC readings as they are being received without missing a single one? You are a few clicks away.
Want to record all USB packets handled by your program and review them later? Same thing.
Live Tracing was originally developed to trace Linux Kernel events, so it’s capable of processing and visualizing huge amounts of data. It supports table views, graphs, indexing, searching, sorting, and anything else you may need to make sense of complex data-sensitive setups.
You can find detailed documentation on Live Tracing on this page or explore the Live Tracing tutorials.
Give It a Try
VisualGDB 6.0 includes several other improvements and fixes. We have improved nRFConnect/ESP-IDF configuration editors, redesigned various GUI and fixed a few glitches. You can download the new release on the download page. If you have any feedback, don’t hesitate to reach us out via our support form or the VisualGDB forum.