Today we are pleased to announce another update to VisualKernel. It brings numerous improvements to the recently introduced tracing engine (see this page for a full change log), but most importantly, it brings the ability to trace Linux kernel (or individual modules) without a regular network connection.
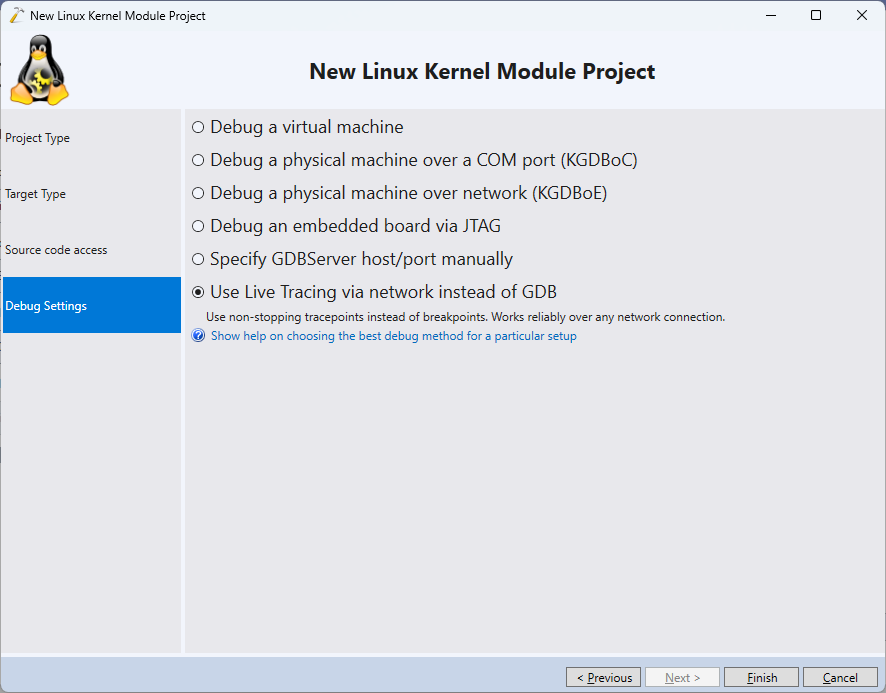
That’s right, even if your target doesn’t have a JTAG connector, is not compatible with KGDBoE and doesn’t support other means of debugging, you can still get pretty close to the regular debugging experience by selecting “Live Tracing” as the debug method:
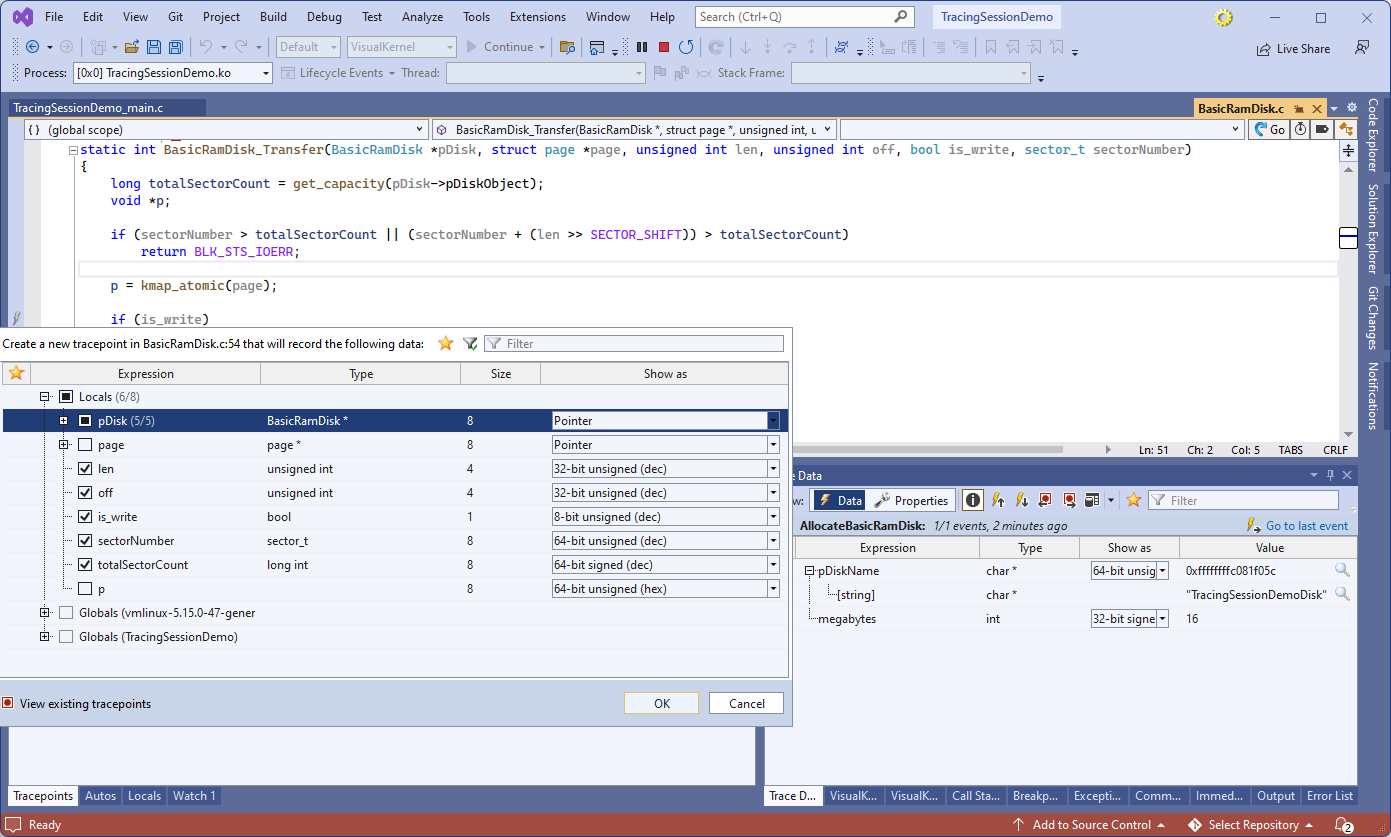
You can set tracepoints anywhere in the code, choose which variables to record, and then just run your code and analyze the collected data in real time. Tracepoints can dive into pointers, selectively capture relevant structure fields, and even support dynamic arrays (e.g. capturing [length] bytes from the buffer pointer in a sys_write syscall).
Tracepoints store the captured data inside an internal buffer that is then read out over a regular network connection. They don’t need any special network driver support like KGDBoE does, won’t lock up your kernel due to deadlocks, and won’t mind multi-core systems at all.
The new VisualKernel 4.1 allows you to export tracepoints into tracepoint sets to share them between projects, organize them in convenient folders, and features various improvements to the graph and table views (e.g. you can export the table reconstructed from the trace into a CSV file).
You can find a detailed description of the kernel tracing functionality on this page, or follow a few tutorials listed here.
Try it Out
You can download the latest VisualKernel here. If you have any feedback, don’t hesitate to reach us out via our support form or the VisualKernel forum.