Live Tracing of Linux Kernel Code
Overview
Live Tracing allows recording the values of arbitrary variables in the Linux kernel each time a given line of code is executed: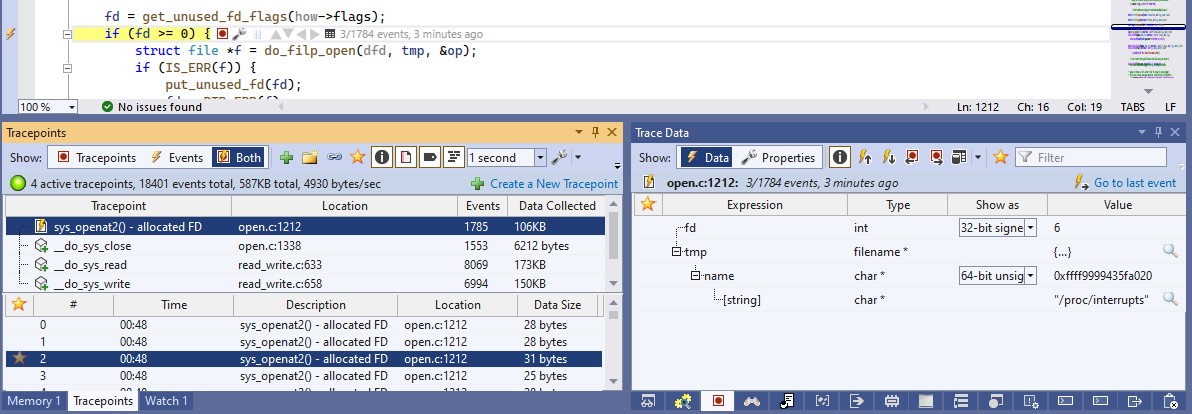 Unlike the regular breakpoints that require a non-trivial debugging setup (e.g. JTAG), tracepoints work over a regular network connection and do not interfere with the normal kernel operation. Each time a tracepoint is hit, it quickly records the pre-selected data into an internal memory buffer, and immediately resumes the execution.
Supported Targets
Live Tracing is supported on all kernel targets that have a usable network connection and are built with kprobe or ftrace support (most stock kernels do). It can be used within a regular debugging session (e.g. using KGDBoE or JTAG), or independently without having to setup a debug connection. The second option is useful on targets where the regular means of debugging are not available.
Creating Tracepoints
Tracepoints can be created during a tracing session, or in advance. There are 3 different ways to create them:
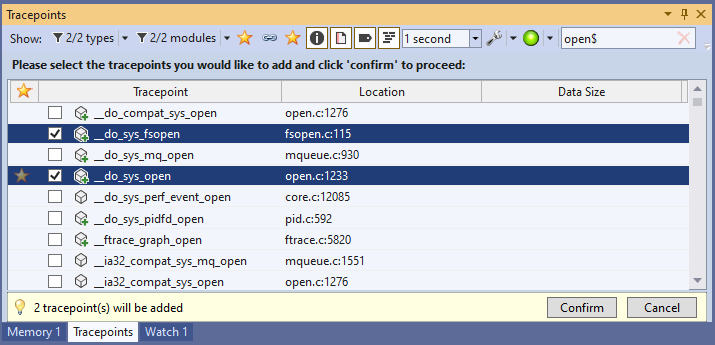
- Via the Debug->Windows->Tracepoints window using the name of the function anywhere in the kernel, or the traced module(s):
- Via the tracepoint links near the function declarations in the code (if enabled from the Tracepoints tool window):
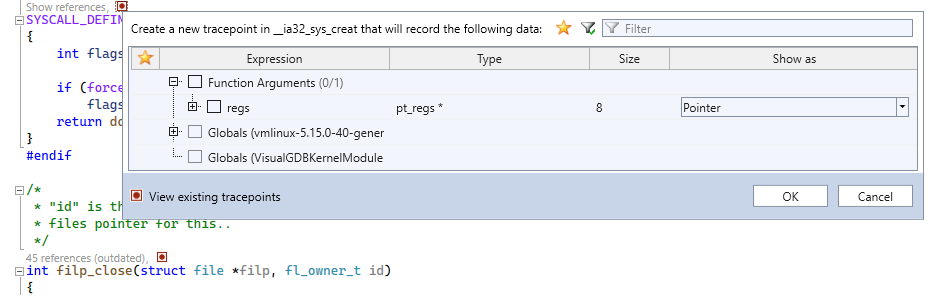
- Anywhere in the code using the tracepoint bar to the left of the breakpoint bar:
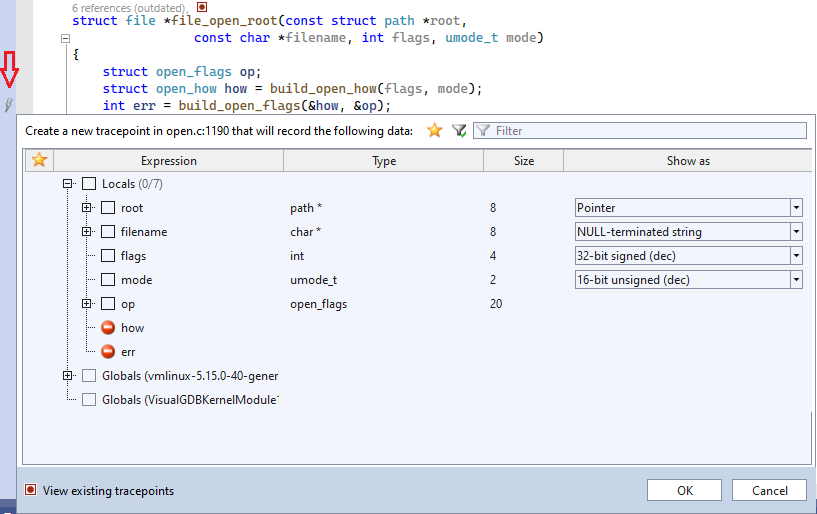
Selecting Traced Data
Each tracepoint can capture the values of arbitrary global or local variables. It can descend into pointers (automatically validating them), handle arrays, and capture NULL-terminated strings: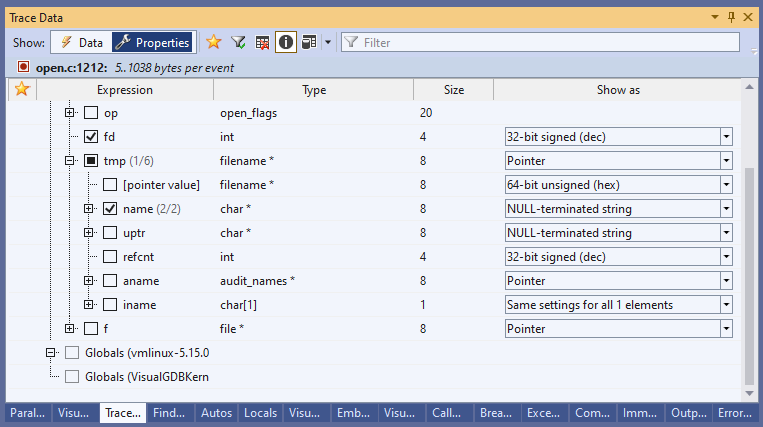 Generally, if a variable value would be visible from a gdb breakpoint, it will be traceable if you set a tracepoint in the same location.
Dynamic arrays (plain byte arrays or arrays of structs) can be captured by selecting “Dynamic Array” in the “Show As” column, and then drag-and-dropping another variable in the “Number of elements” field below: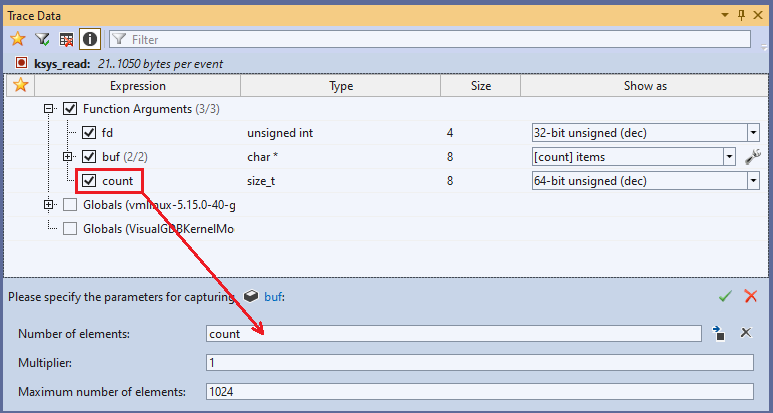
You can set multipliers (e.g. capture 2x[count] elements) and maximum counts to avoid depleting the trace buffer space.
Viewing Trace Data
You can view the events produced by one or more tracepoints by selecting them in the Tracepoints window, or switching to the Events view to view all events: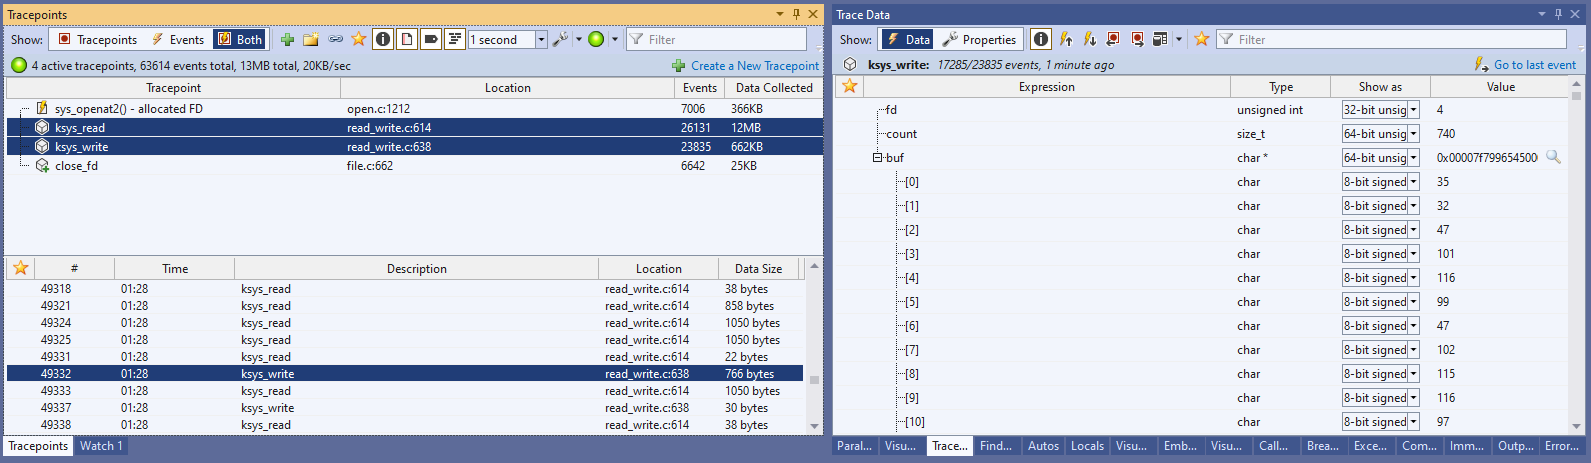
You can also view events by clicking the tracepoint annotations directly in the code: (if enabled via the Tracepoints window):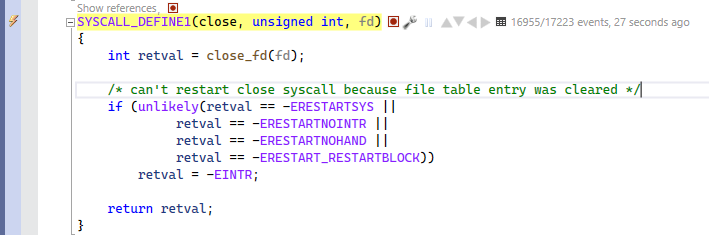
Data Views
You can quickly make sense of large amounts of traced data using the table and graph views. Views can be created via the button in the Trace Data window when recording a trace, or viewing an existing trace file: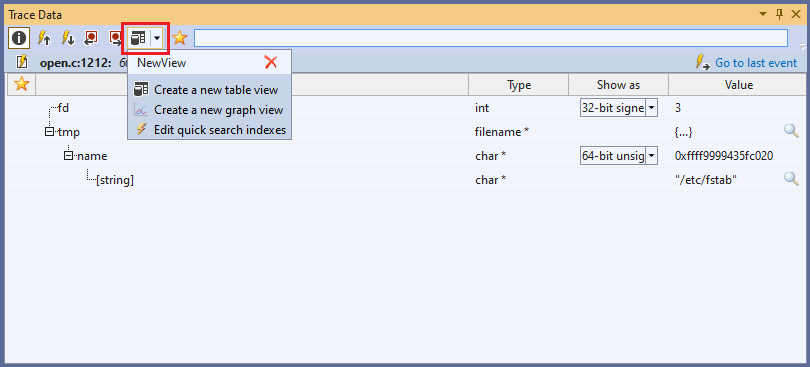 Once a table view is created, you can select drag items from the Trace Data window into the bottom part of the table view, and they will be automatically converted to data columns. Each data column can refer to one or more data items from one or more tracepoints. E.g. creating a “Name” column capturing the file name from sys_openat2() and a ‘fd’ column creating the ‘fd’ variable from open, read, write, and close syscalls can give an instant overview of all read/write oprations going along in the kernel. The screenshot below shows the system calls involved in copying /etc/fstab to /root/fstab:
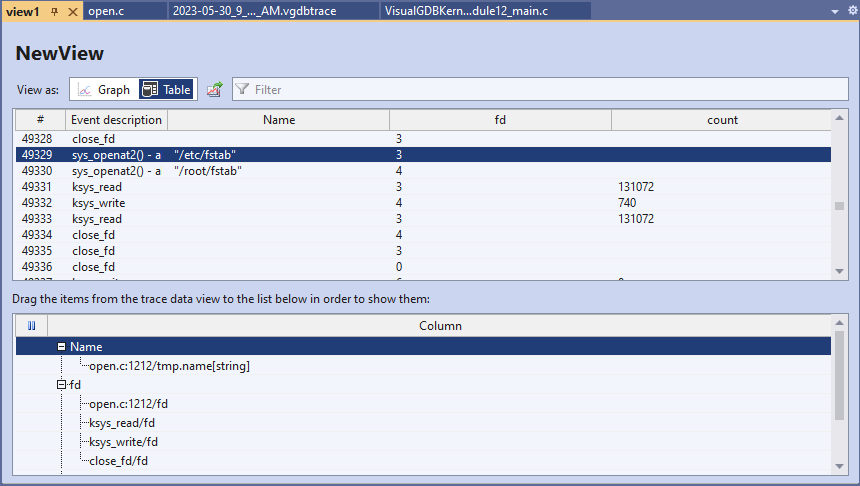 You can sort the table rows by clicking any column header, or simply export the entire table into a CSV file via the export button.
Graph views work similarly to table views – they plot the values of selected variables as they were captured by the tracer. The X axis can show the event number, or an arbitrary variable (e.g. jiffies for the system clock value):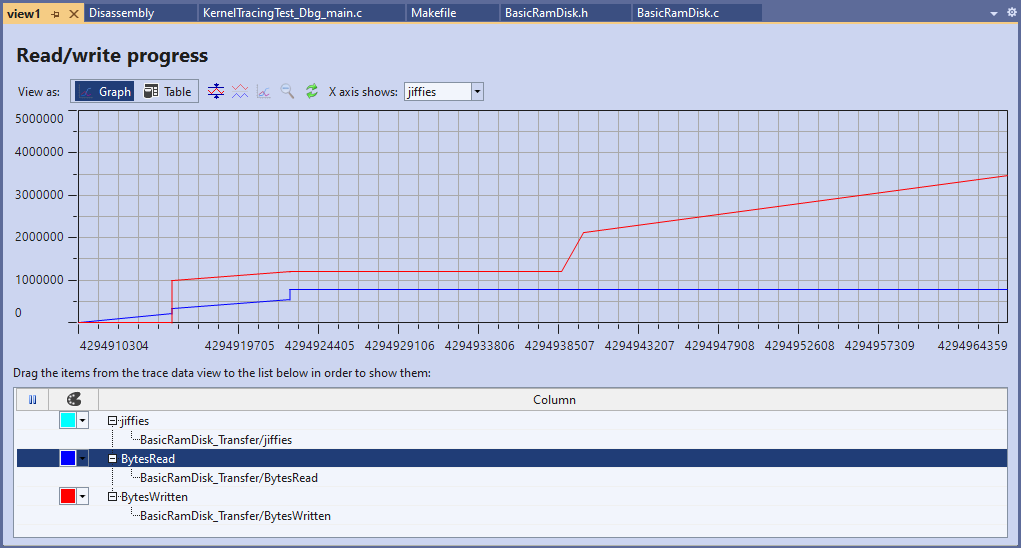
Grouping/Exporting Tracepoints
Tracepoints can be grouped in virtual folders. Selecting a folder will automatically show events from all tracepoints within it (including subfolders): 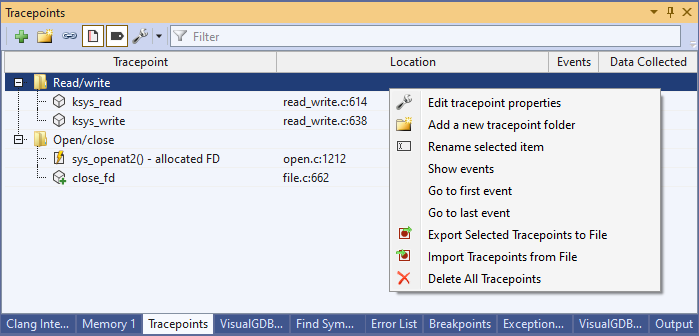 You can also export the tracepoints (along with the data configuration) into XML files, and import them to other projects.
Kernel Modules
If you are tracing a kernel module project, it will automatically recognize when your module is loaded, and will place the tracepoints inside it. You can manually load/unload the main module via the button on the GDB Session window (when tracing during regular debug sessions) or the Tracepoints window (when doing trace-only sessions):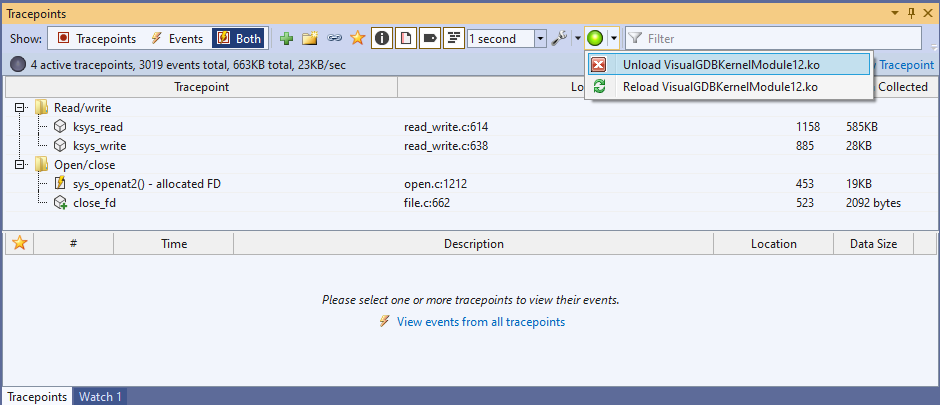 You can also place tracepoints in other modules, as long as you specify their names via VisualKernel Project Properties -> Live Tracing -> Traced in-tree modules:
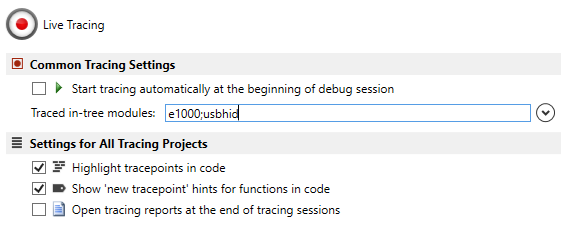
Tutorials
You can find detailed tutorials explaining various Live Tracing functionality on this page.