Today we are proudly releasing VisualKernel 4.0 that introduces a huge usability improvement to kernel debugging workflows.
The Achilles’ heel of kernel debugging is trying to make sense of a complex live system running many operations simultaneously. Breakpoints and stepping provide some insights, but having the entire system stopped in the debugger often has side effects and breaks unexpected things.
VisualKernel 4.0 fixes this with Live Tracing – a new mechanism that allows quickly capturing, recording and reviewing arbitrary data at any point in time that could be interesting: 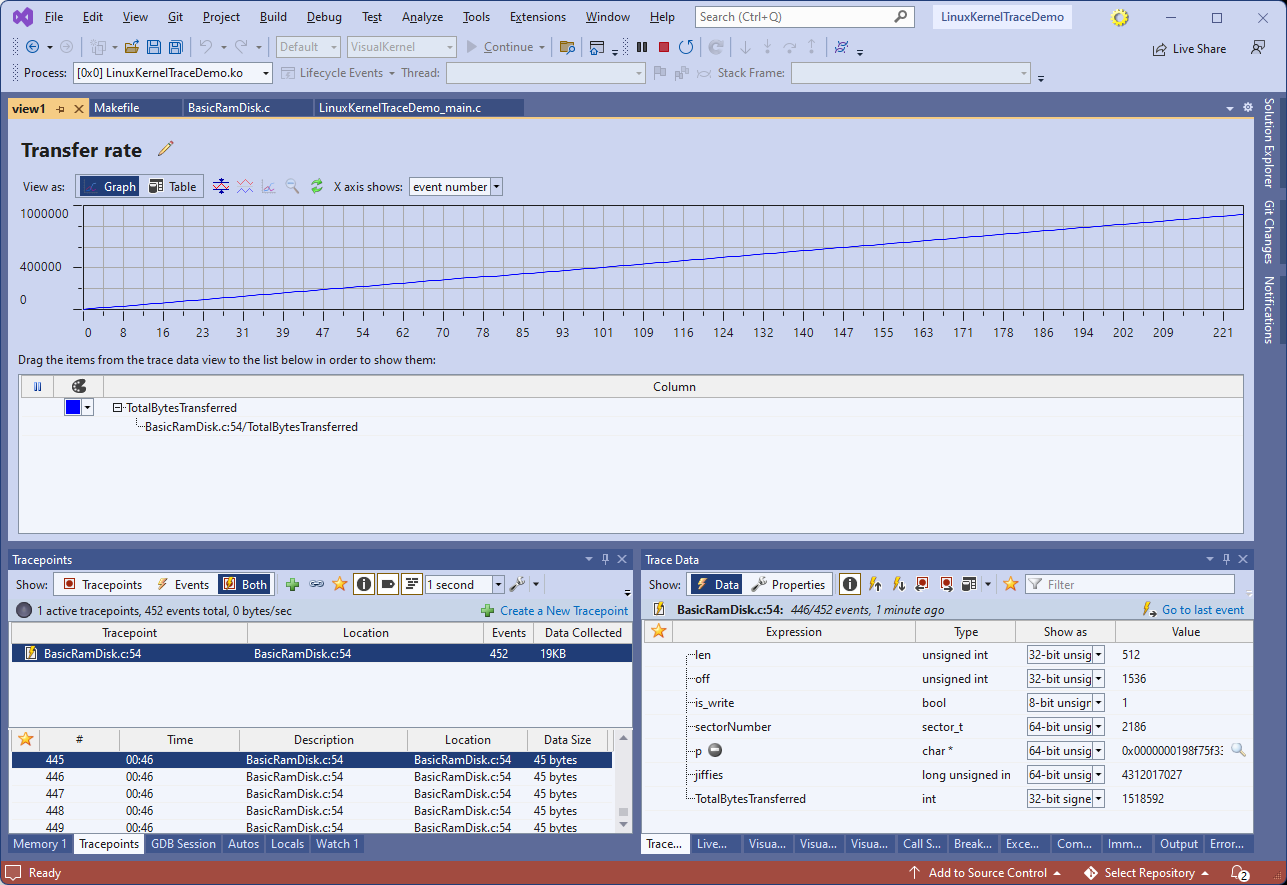 Live Tracing logic runs fully on the target and sends the collected data to VisualKernel via a network connection, so it doesn’t introduce any latency, and doesn’t lock the target while the data is collected.
You can use Live Tracing to trace:
- Named tracepoints defined throughout the Linux kernel
- Any function in the kernel, or your module using ftrace
- Any other location with code using kprobe
Each tracepoint can be easily configured to capture any subset of data, from a few fields or global variables, to the entire variable-sized buffers or arrays: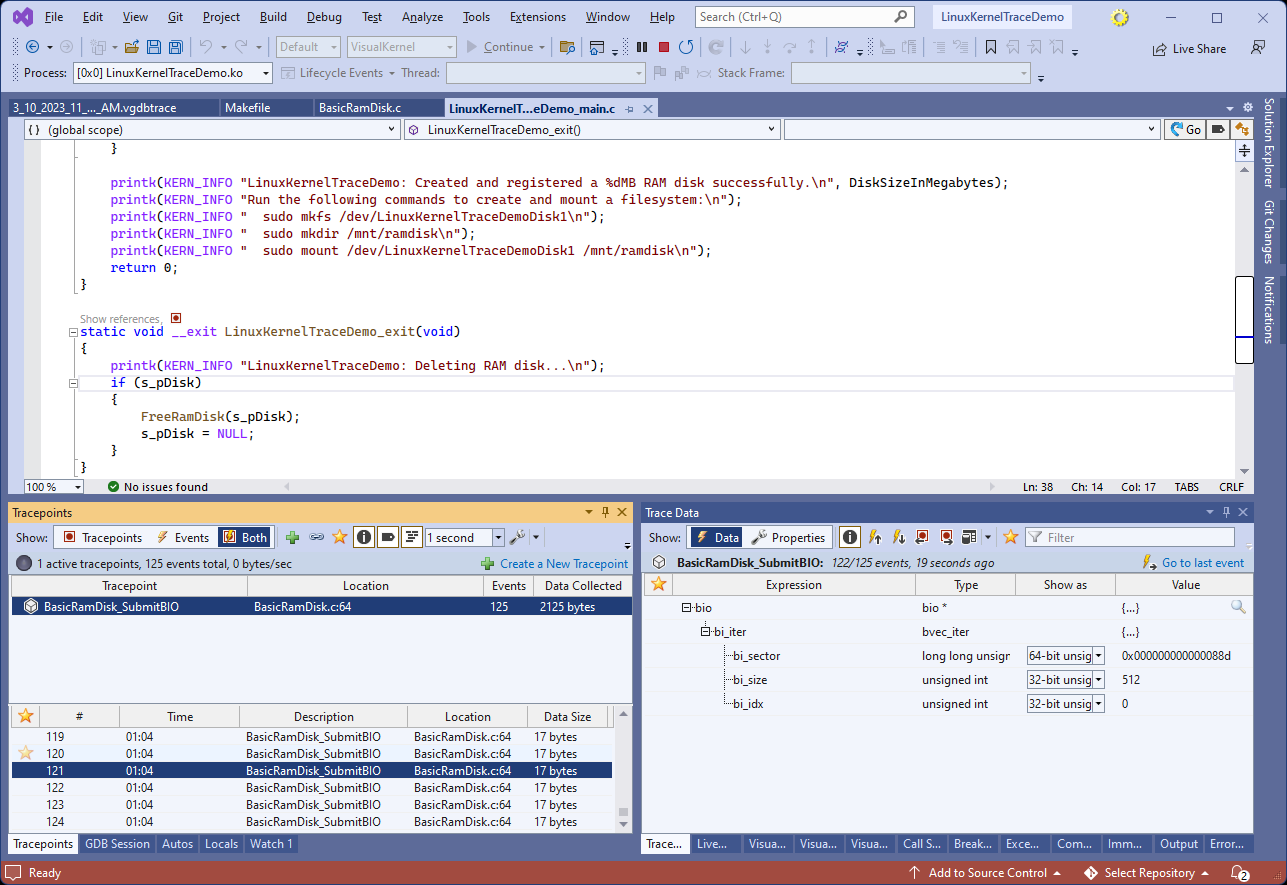 Captured data is automatically saved to trace reports, that can be reviewed later. You can also configure custom table or graph views to quickly browse through series of similarly looking events, and find the relevant parts:
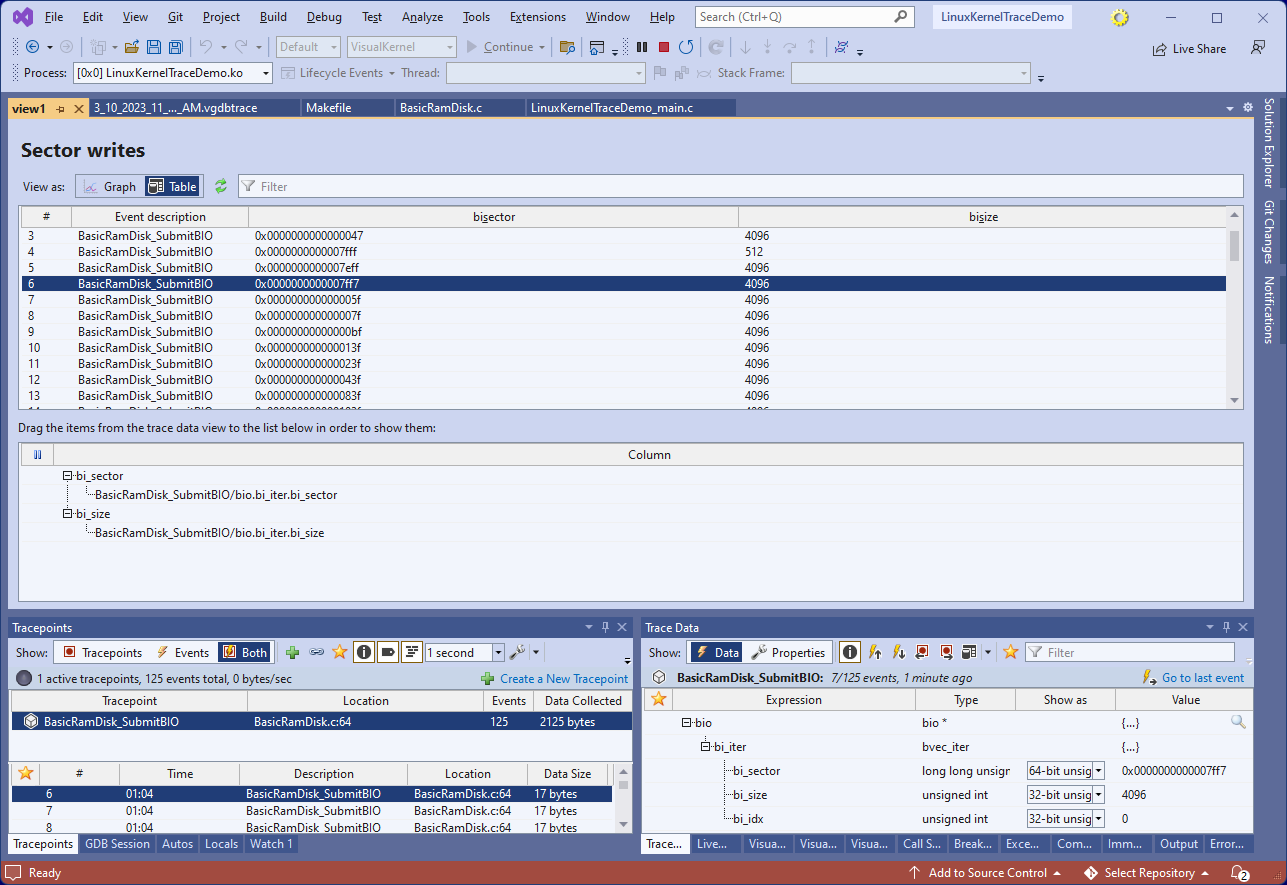 Tracepoints can be added via the new Debug->Windows->Tracepoints tool window, or by using the tracepoint bar on the left side of the text editor.
Try it out
You can download the new VisualKernel 4.0 here. Don’t hesitate to reach out to us with your feedback and we will be happy to make it even better!