The new Visual Watch feature in VisualGDB 5.2 helps quickly visualize the timings of RTOS threads and functions, but what should you do if you want to track something more fine-grain? Thankfully the answer is really simple and I will show you why in just a moment.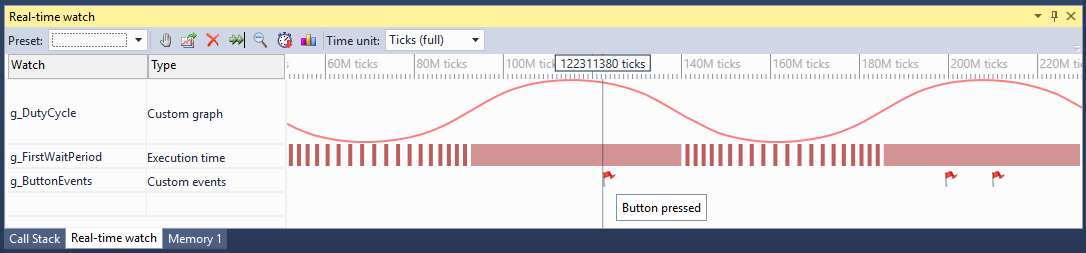
The Test Project
As usual, let’s start with something really simple: a simple program for creating the “Breathing” effect on an LED – gradually changing it from fully on to fully off using pulse-width modulation. The code behind it is just one loop inside one function, so we won’t get away with visualizing it via function run time watch:
for (double arg = 0;; arg += 0.05) { double value = 0.5 + sin(arg) * 1; const int totalPeriod = 50000; g_DutyCycle.ReportValue(value); int period = totalPeriod * value; ScopedRunTimeReporter reporter(g_FirstWaitPeriod); HAL_GPIO_WritePin(GPIOA, GPIO_PIN_5, GPIO_PIN_SET); for (int i = 0; i < period; i++) asm("nop"); HAL_GPIO_WritePin(GPIOA, GPIO_PIN_5, GPIO_PIN_RESET); period = totalPeriod - period; for (int i = 0; i < period; i++) asm("nop"); } |
Let’s start visualizing with the active period of the LED. We could use the Live Variables for that, but Live Variables won’t show the precise time when things happen, as they just periodically read your program’s memory. Real-time watch instead allows you to capture the exact time when events happen, so you can better understand concurrency issues.
Adding a custom real-time watch consists of 3 steps. First, add a reference to the Fast Semihosting and Profiler framework and include the CustomRealTimeWatches.h file:
#include <CustomRealTimeWatches.h> |
Then call the InitializeCustomRealTimeWatch() function from your main():
InitializeCustomRealTimeWatch(); |
Finally add a global real-time watch object:
ScalarRealTimeWatch g_DutyCycle; |
Now you can modify your program to report arbitrary data to this watch:
g_DutyCycle.ReportValue(value); |
If you are using Plain C, you can use the C API instead:
ScalarRealTimeWatch_ReportFPValue(g_DutyCycle, value); |
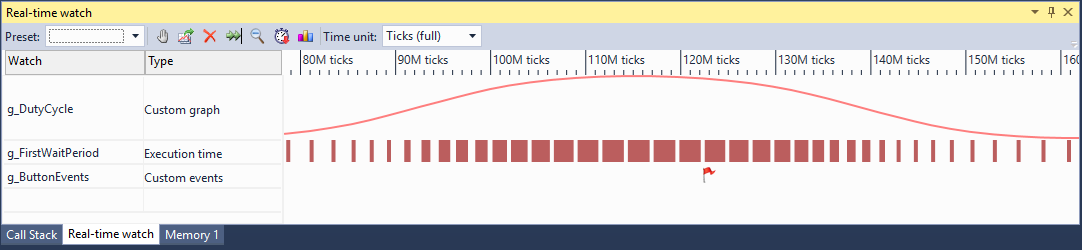
Now all you need to do is start debugging and add g_DutyCycle to the real-time watch window and run your program to view the collected data: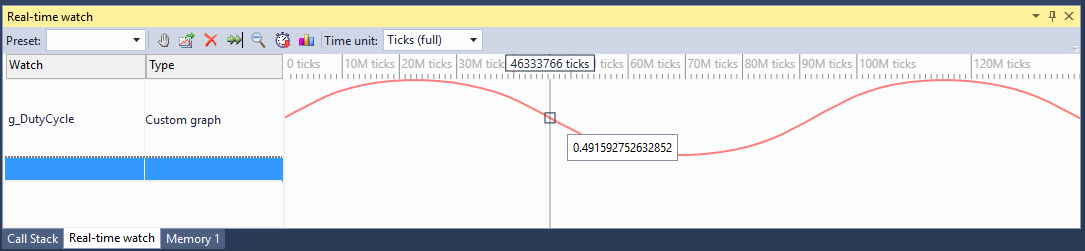
Each data point will be marked with the precise timestamp, so you can measure the precise time between various events: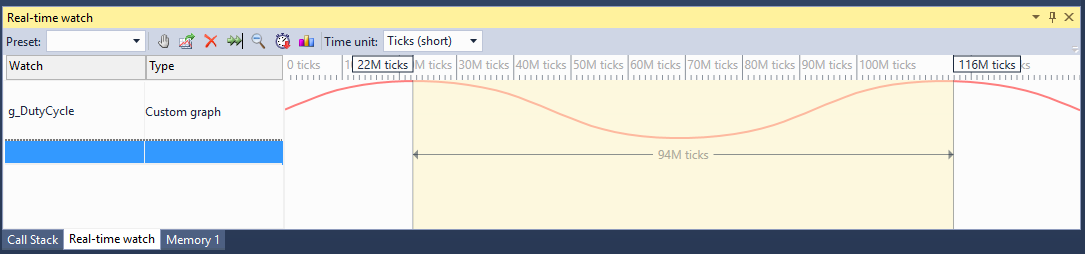
If you are not using the normal profiling functionality, VisualGDB won’t auto-detect the ratio between the debug timer ticks and real milliseconds, but you can easily calibrate it by clicking on “Time unit”: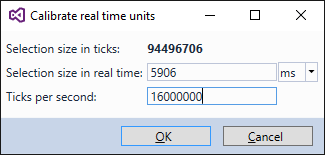
Custom real-time watches report the data to VisualGDB through a circular buffer in your device’s memory, so they don’t produce much overhead. Even better, the actual values are only reported if the watch is present in the Visual Watch window and not paused, so you don’t need to recompile your program each time you want to watch something new.
More Watch Types
Apart from ScalarRealTimeWatch VisualGDB supports two other types of custom real-time watches. Let’s summarize them in a table:
| Watch type | How to declare | How to report data | ||
| Precise run time of arbitrary code blocks |
|
|
||
| Arbitrary events |
|
|
The run time watch will capture the exact start and stop time of any block of code, so you can use it to compare execution times of various parts of your function. The event stream watch can show arbitrary events, so you can use it to display things like buffer overflows or button presses. The simplest example would be to use the execution time reporter to track the times when the LED is on:
{ ScopedRunTimeReporter reporter(g_FirstWaitPeriod); HAL_GPIO_WritePin(GPIOA, GPIO_PIN_5, GPIO_PIN_SET); for (int i = 0; i < period; i++) asm("nop"); } |
Overhead
Reporting data via real-time watch is just a matter of storing it inside RAM in a format that VisualGDB can read, so it does not slow down your program too much. However if the enabled watches generate too much data, the program will be paused until VisualGDB can read the data and that could slow it down considerably. So if you want to use Real-time watch to record something very intense, set a breakpoint before and after the intense block to give VisualGDB enough time to empty the buffer before the heavy action starts.
Download
You can download VisualGDB 5.2 Preview 2 with the real-time watch feature on the download page. We would appreciate any feedback on the new features and bugs, so don’t hesitate to drop us an email or contact us via the support form.