One of the features most wanted from VisualGDB before version 5.2 was to detect stack overflows on embedded devices. On a typical ARM Cortex microcontroller where every byte counts, running out of stack space is not something out of the ordinary, and it can have catastrophic consequences and be hard to debug. So VisualGDB 5.2 Preview 2 comes with a feature that makes the stack usage analysis completely automatic and tracks the overflow event when it happens: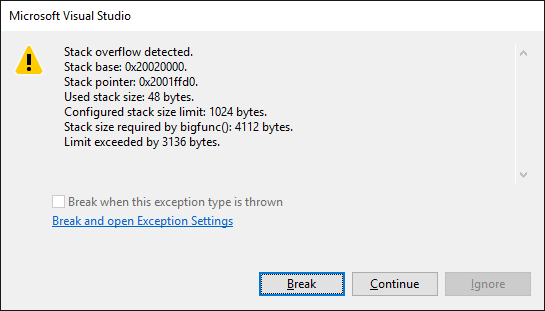
Enabling Stack Verifier
All you need to do to get your stack usage automatically checked is enable this feature on the Dynamic Analysis page of VisualGDB Project Properties (Custom edition and higher):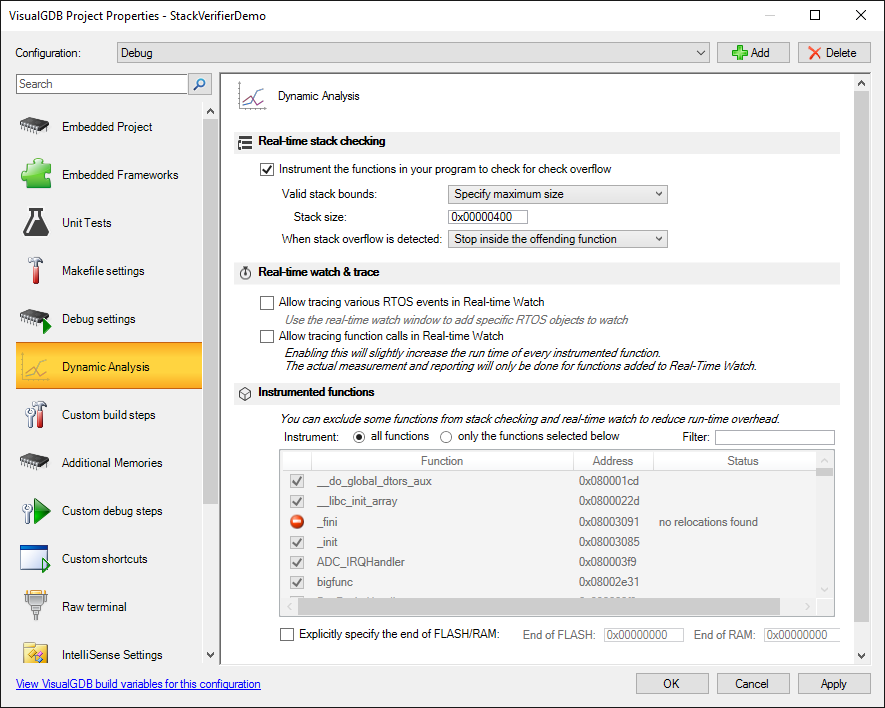 VisualGDB will suggest doing 2 things: referencing the profiler framework and adding a GCC flag that dumps the stack usage by each function into text files. You will also need to specify the stack size that you want to enforce (unless you are already using the fixed stack/heap feature that comes with the new BSPs) and you are good to go.
Now if any of the functions in your program ends up using stack space below the stack limit, VisualGDB will stop your program and show you detailed information about the offending function:
How This Works
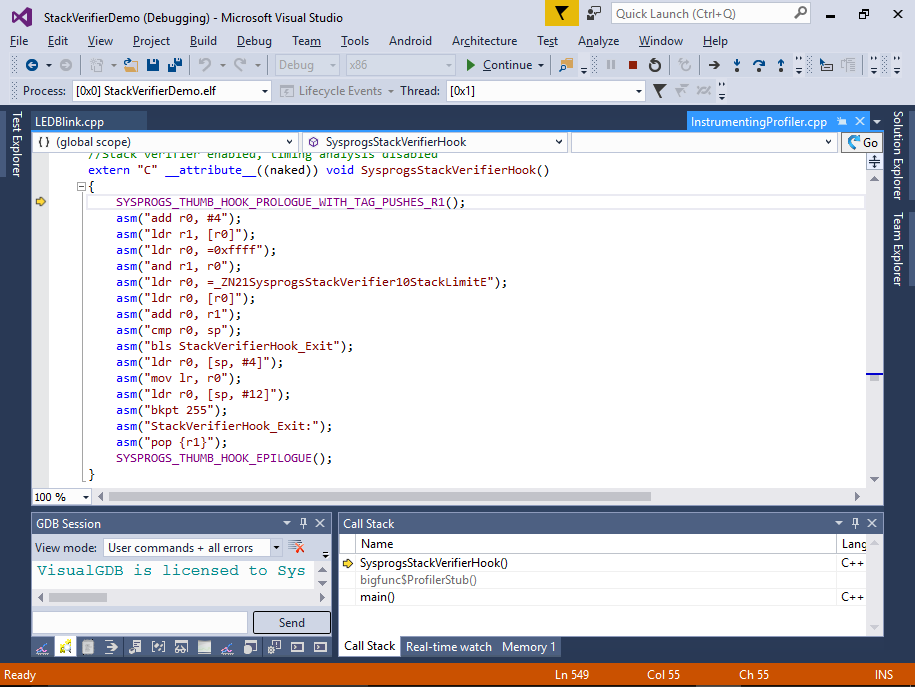
The Stack Verifier uses the same mechanism as the embedded profiler: it hooks every function in your program and redirects it to a small piece of code that compares the current stack pointer (plus the expected stack usage inside the function) to the configured stack limit. If the stack pointer gets too low – kaboom! The code responsible for checking the stack is fairly small, so it does not introduce a considerable slowdown to your program and it’s done after linking, so the rest of your program is exactly the same as it was before instrumentation.
Limitations
There are a few cases when the verifier won’t catch the problem immediately. First is the dynamic stack allocation. If your functions call alloca() to allocate stack space dynamically, the stack usage cannot be determined at the compile time, so the stack verifier will not see the problem at the function entry. If the function calls another one while the stack was already allocated beyond the limit, it will still get caught.
The other limitation is the library functions. GCC does not provide stack usage information for those, so again the stack verifier will trigger if the stack pointer was already below the limit, but won’t detect it if the function itself used some space in the forbidden zone.
RTOS support
Yes, yes, yes. You can use it with FreeRTOS. Other RTOSes as well, but that would require a very small modification to the code.
The logic behind RTOS support is simple – each time a thread switch happens, the profiler framework updates the SysprogsStackVerifier::StackLimit variable to point to the thread’s stack limit. VisualGDB recognized FreeRTOS automatically and hooks the thread switching function to do that transparently, but if you want to use the stack verifier with another RTOS, you will need to do it yourself by calling SysprogsProfiler_RTOSThreadSwitched().
Download
You can download VisualGDB 5.2 Preview 2 with the new stack verifier from the download page. All feedback on it is welcome via our contact form or support emails.