One of the toughest types of problems faced by embedded software developers is timing problems. Seeing what exactly happened before a problem popped up and being able to put multiple events on one scale could save hours of time. The previous version of VisualGDB included an embedded profiler that could collect statistics on the runtime of various functions. VisualGDB 5.2 takes this even further and introduces Real-time watch – a framework for convenient recording and visualization of various real-time events in your program that works out-of-the-box with FreeRTOS and supports non-RTOS environments as well: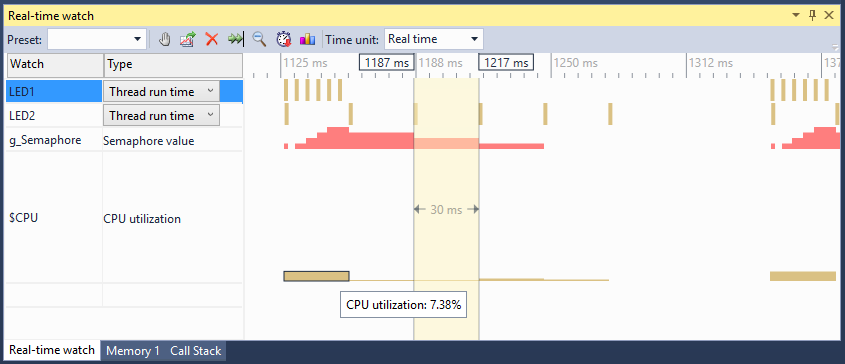
Supported platforms
Real-time watch works with any ARM Cortex microcontroller that can be debugged with either OpenOCD or Segger J-Link software. It consists of a transparent framework that sends timing information to VisualGDB over JTAG/SWD and a set of GUI in VisualGDB that allows easily selecting what information to collect and presents it in a understandable form.
Setup
We have made Real-time watch extremely easy to setup. Simply go to the Dynamic Analysis page of VisualGDB Project Properties and enable it for the event types you want to trace: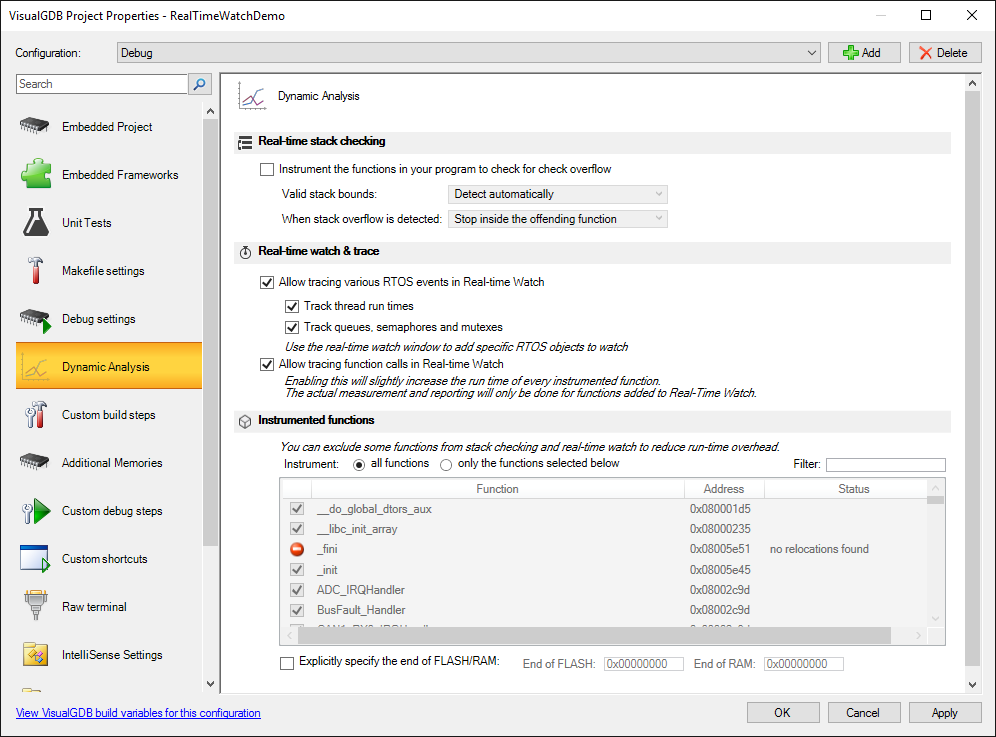 In the pre-release version you will need to add the USE_FREERTOS macro to project properties (if you are using FreeRTOS) and call the initalization function from your main(), but once we update our BSPs for the most popular platforms, this will be done automatically.
Enabling real-time watch will automatically add a reference to the Fast Semihosting and Profiler framework: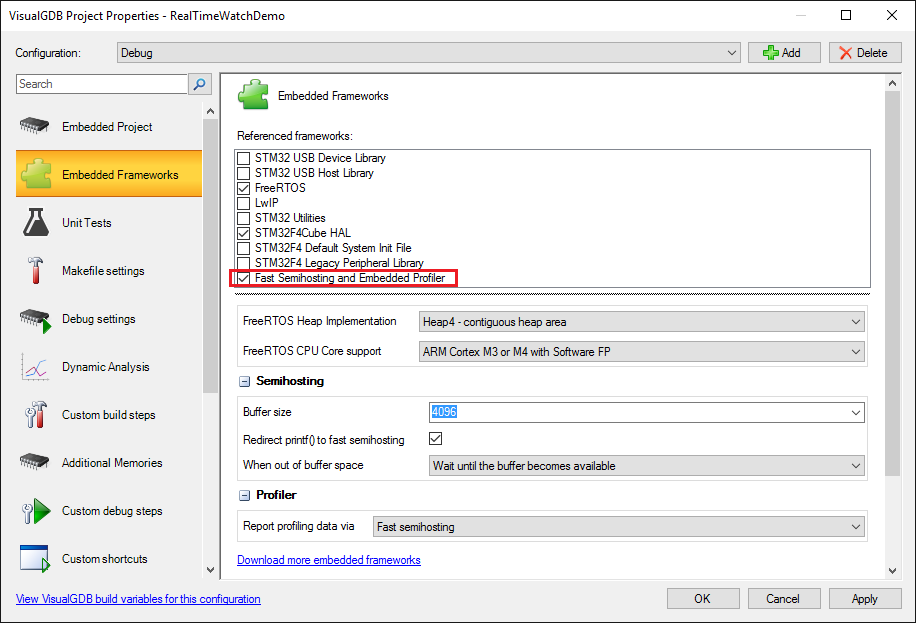
The framework itself won’t interfere with your program’s workflow unless you explicitly enable Visual Watch, but enabling it will automatically activate its full power of recording and displaying what is going on in your program.
Viewing function timing
Let’s start with something easy. Create a basic “Blinking LED” project, enable real-time watch in the VisualGDB Project Properties and get a nice graphical representation of the interrupt handler, delay function and the function that toggles the LED.
Once you enabled it on the Dynamic Analysis page, simply start a normal debugging session, let it stop at a breakpoint, open the Real-time watch window and add the HAL_Delay, HAL_GPIO_WritePin and SysTick_Handler functions there: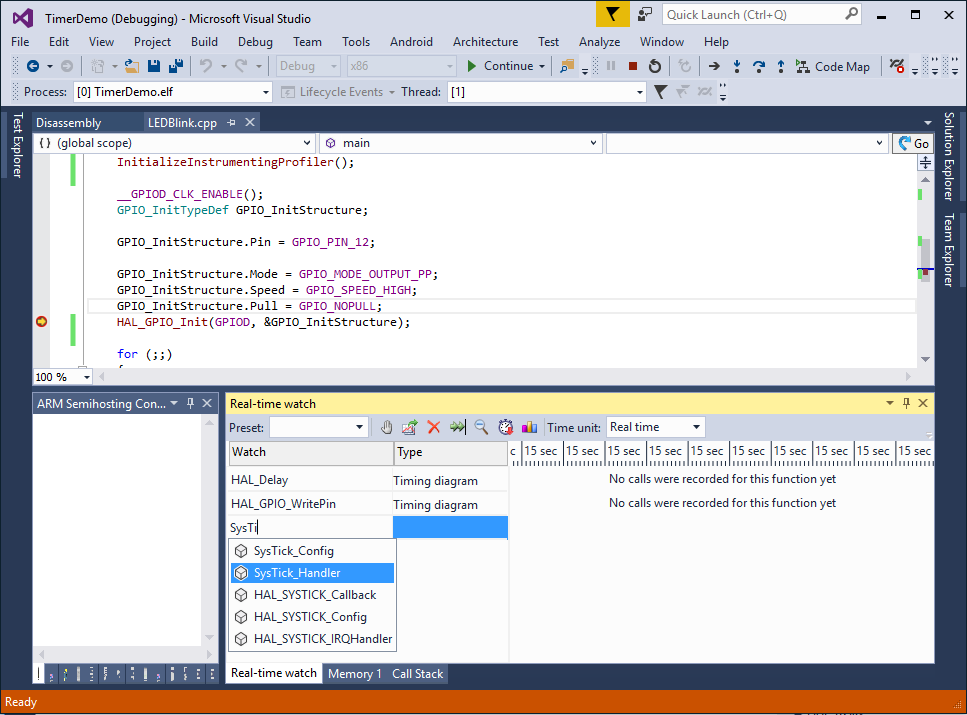
VisualGDB will automatically do the instrumentation magic and once you hit F5 it will begin plotting the function run time in the real-time watch window: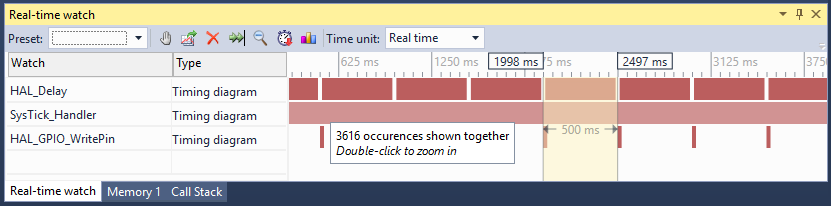
That’s exactly what would expect: HAL_Delay() taking most of the time, HAL_GPIO_WritePin() getting called every 500 ms, timer interrupt firing all the time. The window is fully interactive, so you can zoom in/out and measure precise timing of various events: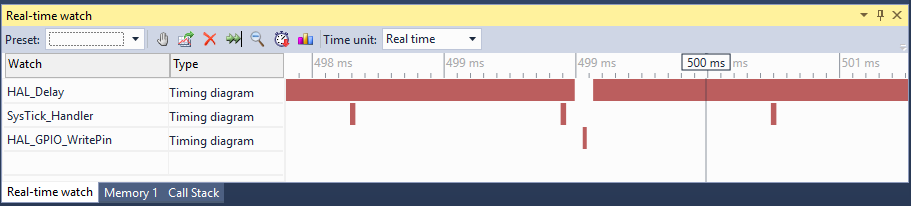 Tracing every call of a function that gets executed too often can create a considerable overhead, so we made it easy to estimate and manage it. First of all, the statistics button displays the estimated overhead:
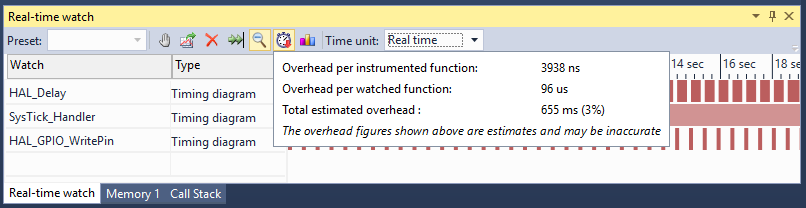
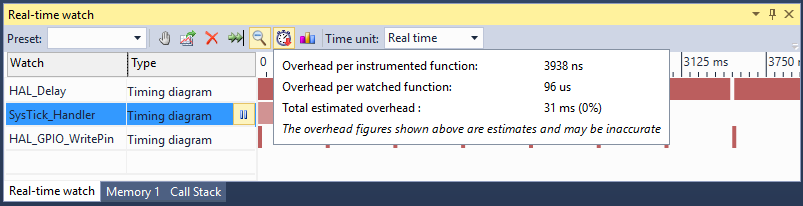
Second of all, VisualGDB goes smart about instrumenting the functions, so if you pause the recording for some of them, or remove them from Visual Watch, the overhead will be reduced without restarting your program:
Finally, we have automated adding/removing of functions via presets. Simply save a set of watched functions as a preset and you can get back to recording them any time you want:
RTOS integration
Real-time watch goes beyond just measuring the function run times. It can seamlessly plot various events inside your RTOS:
- The exact time when each thread was running
- Queue/semaphore use over time
- Mutex ownership over time
- Overall CPU utilization and per-thread CPU utilization
FreeRTOS is supported out-of-the-box, other RTOSes can be supported via the extension SDK.
Let’s look at something easily recognizable: a basic producer-consumer pattern. One thread will be producing 5 tokens at a time with a large pause afterwards and another one will be slowly consuming them one-by-one. The threads will use a FreeRTOS semaphore to communicate to each other:
static void LED_Thread1(void const *argument) { for (;;) { for (int i = 0; i < 5; i++) { HAL_GPIO_TogglePin(GPIOD, GPIO_PIN_12); osSemaphoreRelease(g_Semaphore); osDelay(5); } osDelay(200); } } static void LED_Thread2(void const *argument) { for (;;) { while (osSemaphoreWait(g_Semaphore, -1) == osOK) { HAL_GPIO_TogglePin(GPIOD, GPIO_PIN_13); osDelay(30); } } } |
For simplicity, we don’t send any actual data between the threads, but we use the semaphore as if we were sending it.
The second thread takes 30 milliseconds to process a token and the first one produces 5 of them in short succession and then waits for 200 milliseconds. This should result in the semaphore going quickly from 0 to 5 and then slowly back to zero as the tokens are consumed. Let’s build this, start debugging, stop it once the threads are created, and add both threads and the semaphore variable to real-time watch: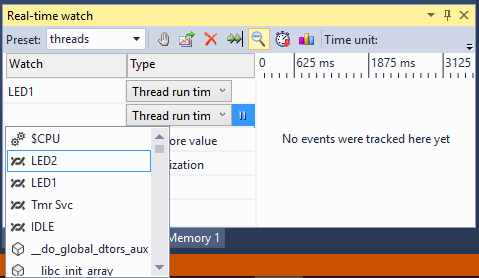
After you resume the session you will quickly see that the thread run times and the semaphore value follow a periodic pattern: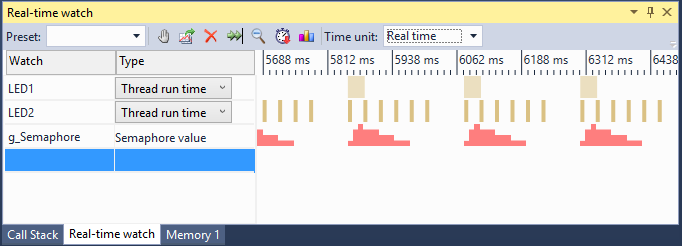
Zoom it in to see what’s going on. As expected, the semaphore value quickly grows in the beginning of the cycle and then decreases by 1 every 30 milliseconds. The thread timing bars show the exact time when each thread was active. Note how when a thread calls the osDelay() function, FreeRTOS automatically switches to another thread:
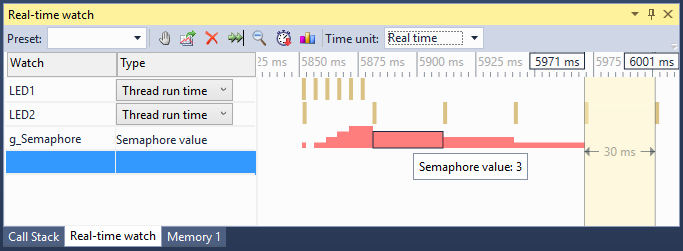
The graph also shows that the semaphore value did not grow to 5 and stayed at 4 for a short while because the second thread started processing the first token as soon as first thread started sleeping for the first time.
Let’s experiment a little more with the threads and enclose the code that produces 5 tokens and the code that consumes them with a mutex.
static void LED_Thread1(void const *argument) { for (;;) { osMutexWait(g_Mutex, -1); for (int i = 0; i < 5; i++) { HAL_GPIO_TogglePin(GPIOD, GPIO_PIN_12); osSemaphoreRelease(g_Semaphore); osDelay(5); } osMutexRelease(g_Mutex); osDelay(200); } } static void LED_Thread2(void const *argument) { for (;;) { while (osSemaphoreWait(g_Semaphore, -1) == osOK) { osMutexWait(g_Mutex, -1); HAL_GPIO_TogglePin(GPIOD, GPIO_PIN_13); osDelay(30); osMutexRelease(g_Mutex); } } } |
Real-time watch can show the mutex owner on the same scale and easily visualize what has changed: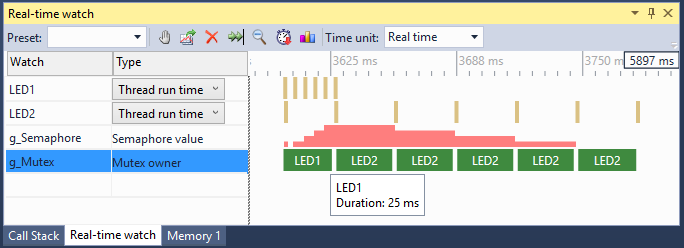
Report files
The data collected by the real-time watch does not have to disappear when you close the debug session. Instead you can export it to a real-time watch report file, open those reports in Visual Studio and compare them side-by-side: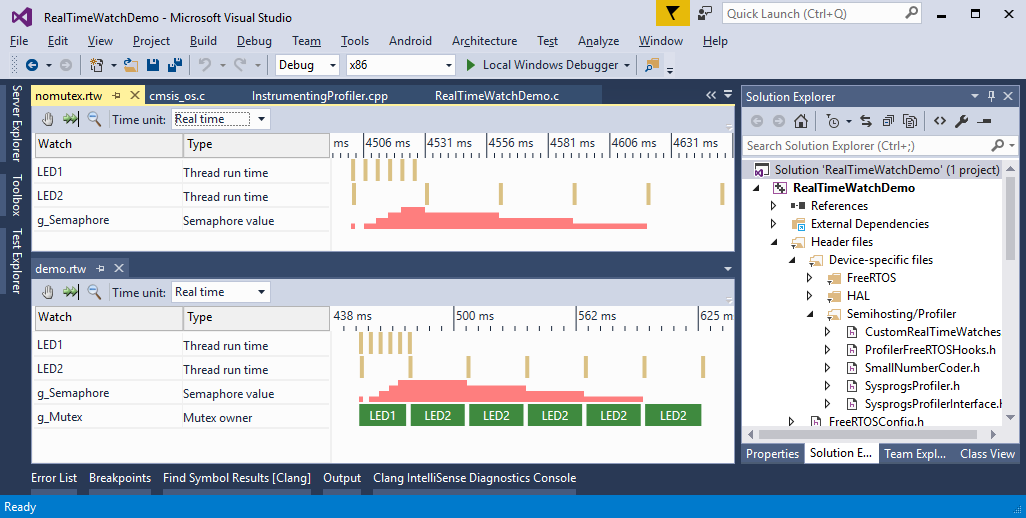
More features
Real-time watch can also visualize custom events, custom graphs and track execution time of custom code regions without the need for instrumenting any functions. Follow us on twitter to learn more about the customization features.
Download
The real-time watch feature is available starting from the Custom edition in VisualGDB 5.2 and later. You can download the Preview version of VisualGDB 5.2 on the download page. Feel free to share your feedback with us via our contact form or by dropping us an email.
.