Today we are happy to announce the stable release of VisualGDB 6.0. If you haven’t tried the Beta releases yet, the biggest feature to check out would be the new Tracing Engine.
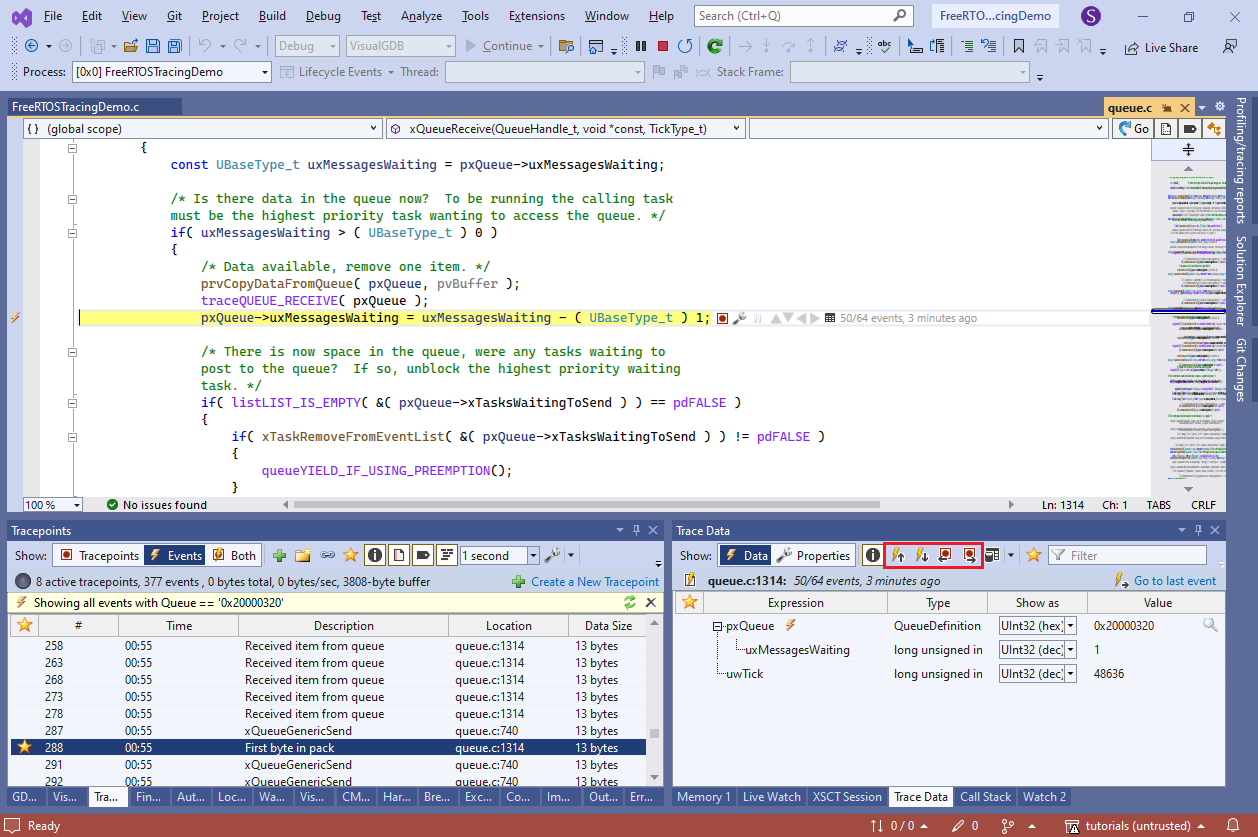
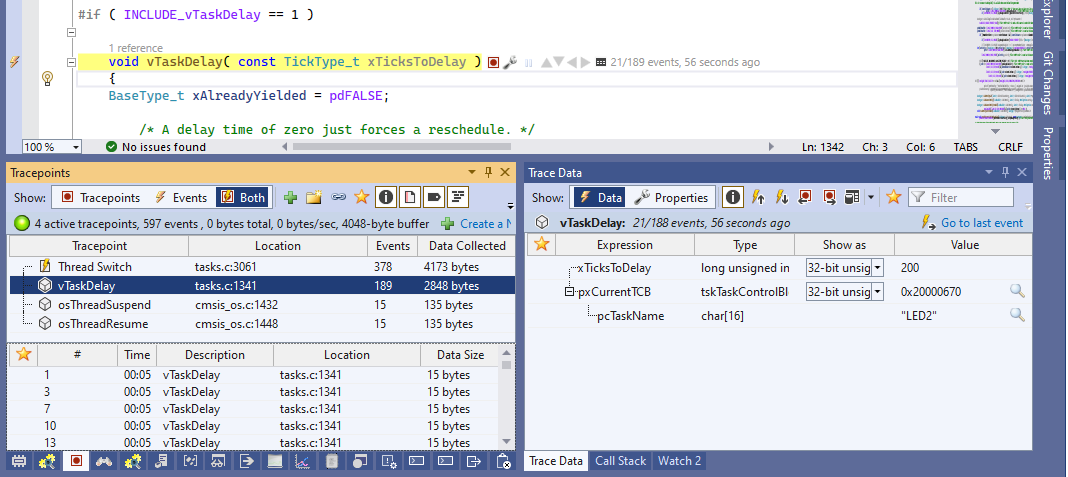
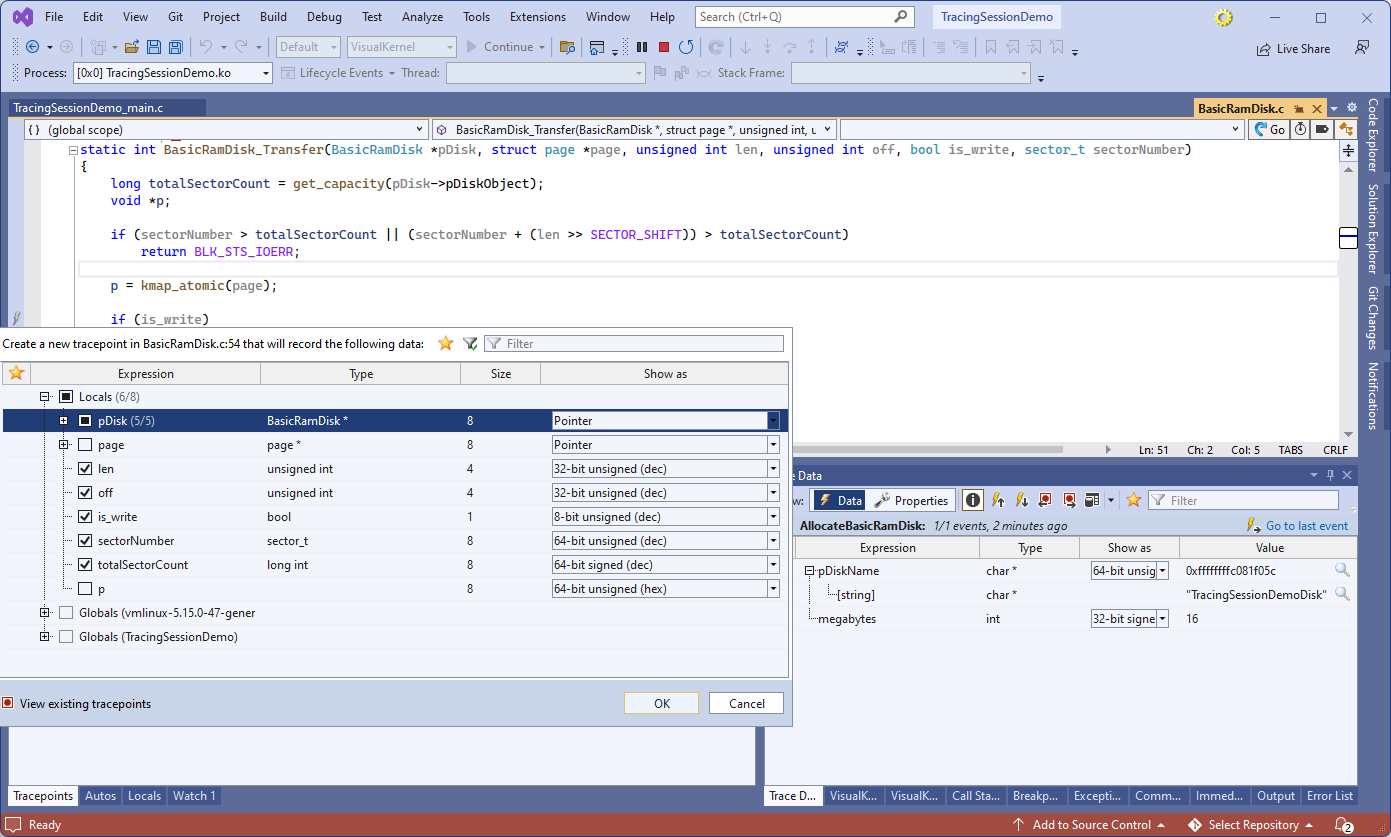
It allows placing tracepoints anywhere in the embedded code that will record the data you selected, with minimal disruptions to the program flow: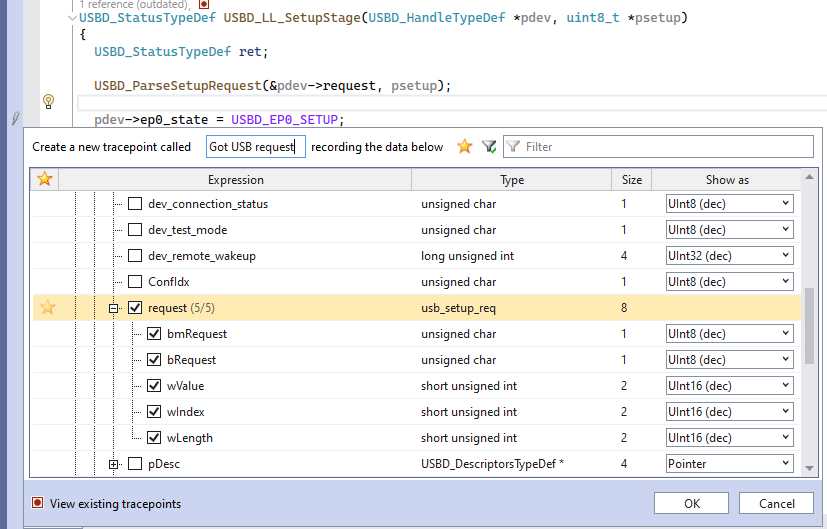 Tracepoints run directly on the target and store the collected data in a circular buffer inside the device’s memory, so they are not affected by JTAG latency, and generally run very fast.
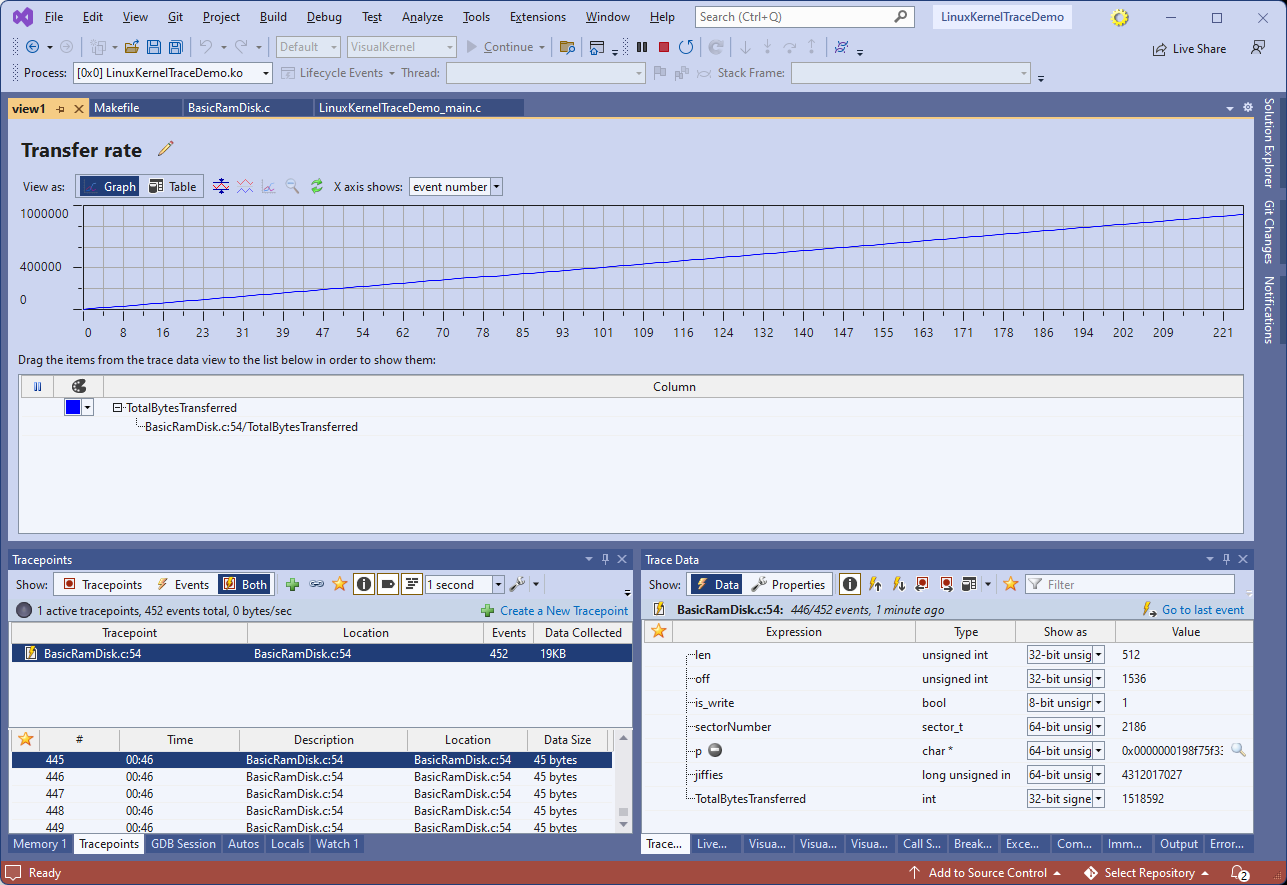
You can step through the recorded events while the program is still running, or save them into a report file, and review it later: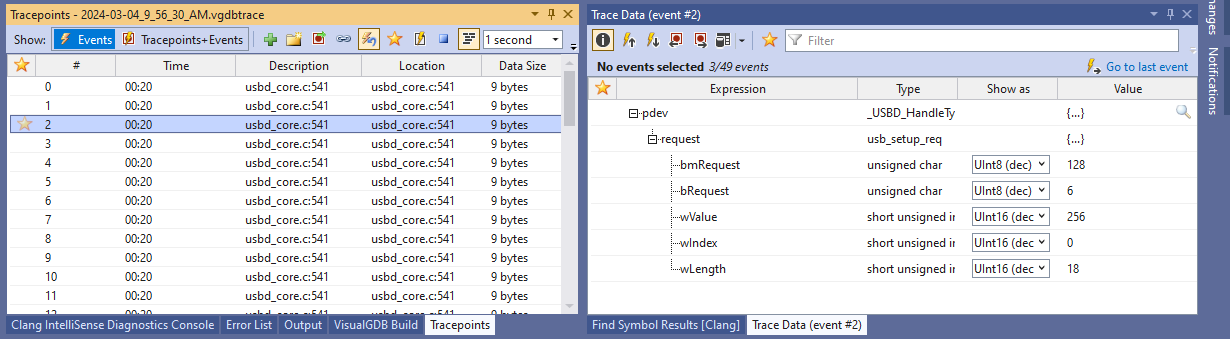 Tracing makes it easy to debug real-time code where stopping the target even for a few milliseconds is not acceptable. Think logging USB requests, recording DMA state at different stages of signal generation, storing every sample coming from an ADC, logging every thread switch, etc.
You can find various tutorials on software tracing here, and more are on the way!
If you have already tried the Betas, the final 6.0 release brings numerous usability improvements to tracing: you can now format pointers values as [nearest symbol + offset], record void * variables as dynamically-sized byte arrays, properly format IP addresses, dump multiple trace events into easy-to-read text files, or convert the trace reports into a machine-readable XML format.
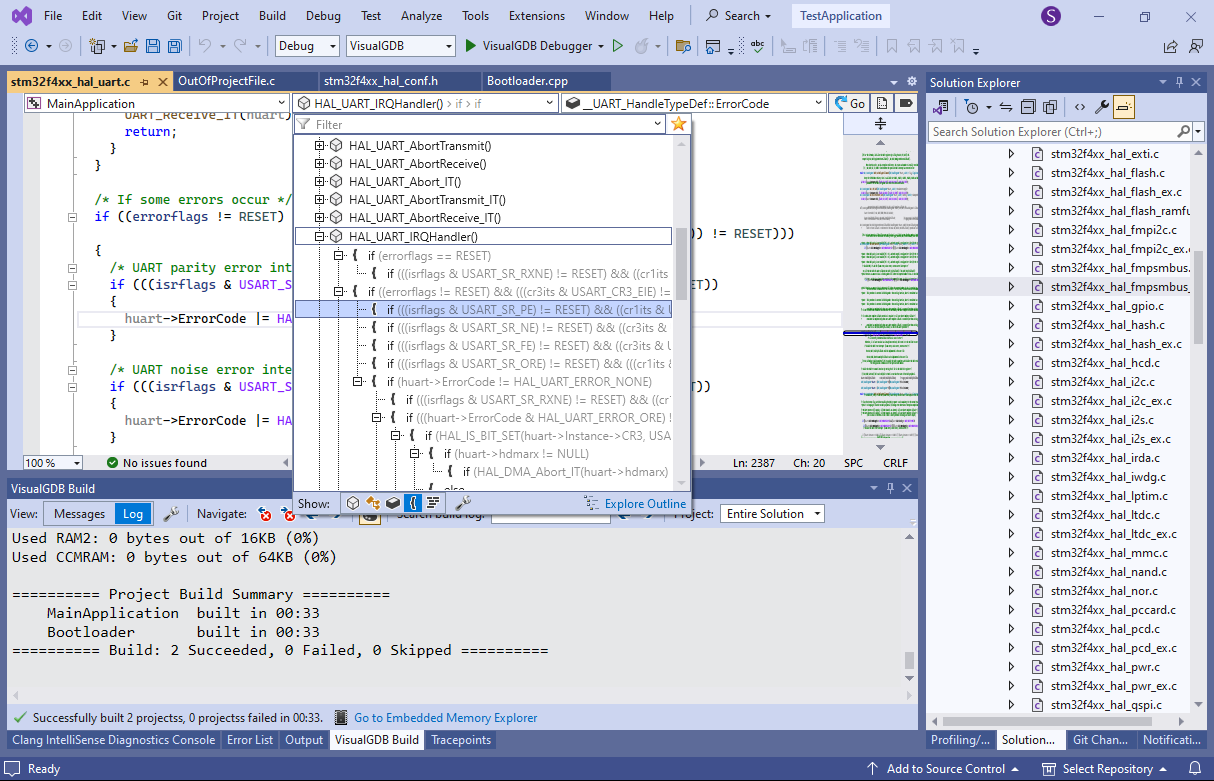
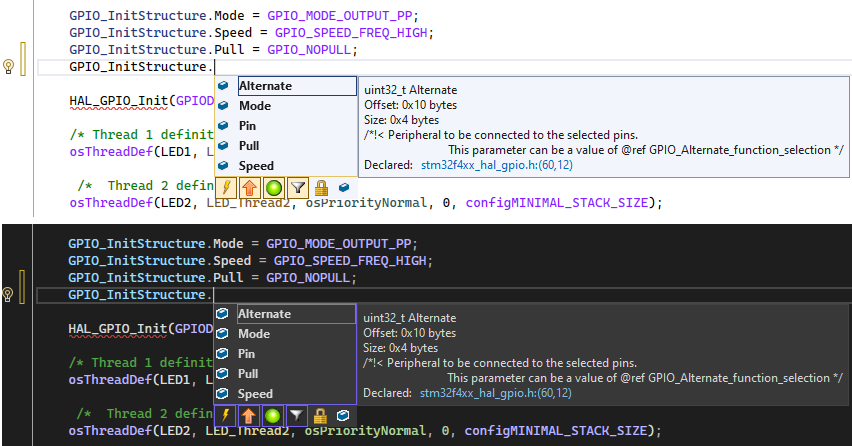
Other v6.0 changes include a newer IntelliSense engine based on Clang 16.0, full support for ARM64 hosts (e.g. Macbook), Unlimited FLASH breakpoints on STM32 with OpenOCD, and numerous other fixes and usability improvements.
Try it out
You can download VisualGDB 6.0 here or use the VisualGDB Package Manager to update from an older version. If you have any questions or suggestions about the new release, do not hesitate to reach out to us.