The idea of making a “soft logic analyzer” that will run on top of popular prototyping boards has been crossing my mind since we first got acquainted with the STM32 Discovery and Nucleo boards. The STM32 GPIO is blazingly fast and the built-in DMA controller looks powerful enough to handle high bandwidths. So having that in mind, we spent several months perfecting both software and firmware side and here is what we got in the end.
Capturing the signals
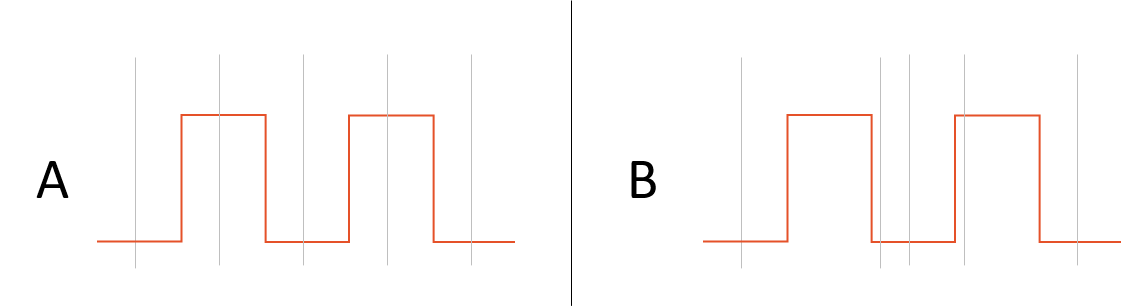
The main challenge when using a microcontroller like STM32 as a core of a logic analyzer is dealing with sampling irregularities. Unlike FPGA-based analyzers, the microcontroller has to share the same resources to load instructions from memory, read/write the program state and capture the external inputs from the GPIO. Given that, it could be tricky for the microcontroller to keep up the sampling frequency perfectly straight and could make the capture very innaccurate. To quantify that, I designed a simple test. The on-board timer was configured to generates series of signals with different characteristics and the DMA was used to record their parameters and compare them with the expected ones: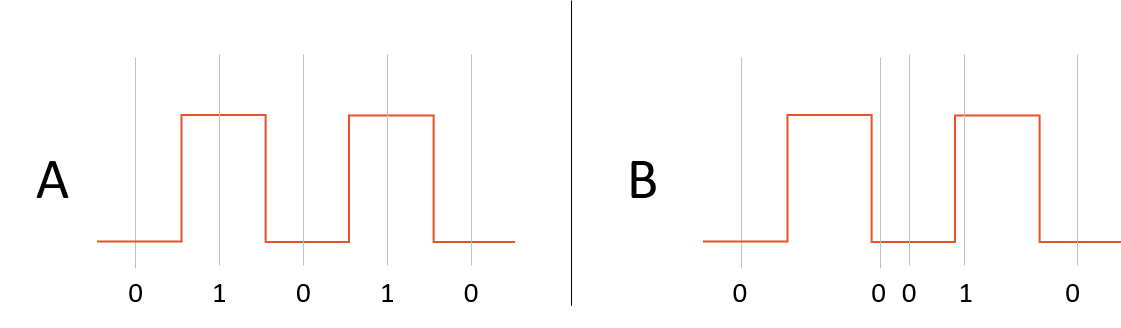 The general idea is that if a test signal is sampled with regular intervals (A), it will always appear as the same repeating sequence of zeroes and ones, while if the sampling becomes sporadic (B), it will quickly introduce observable distortions. Having this methodology mind, we conducted several tests and discovered a few interesting results:
- The STM32 DMA was unexpectedly fast. It can reliably read GPIO inputs every 3th or 4th clock cycle on many devices. For fast boards like STM32F746-Nucleo this means sampling frequencies up to 72 MHz.
- If the CPU is properly stalled for the duration of the sampling, it is extremely precise given that it is configured properly.
Compressing the signals
Sampling the inputs at the maximum speed imposes an important limitation. Once the on-board RAM is filled with the data, the sampling needs to be stopped to transfer the data to the computer. While capturing ~1ms at 72MHz could be sufficient for fast and periodic signals, it could be hard to catch the interesting part if the signal is sparse. To support that, we experimented with doing double-buffered compression: while the DMA was filling half of the buffer with raw samples, the CPU was reading through the other half and doing a very basic compression.
This brought back the challenge of uniform sampling: if the CPU was not just waiting, but actively accessing the memory, the DMA controller had to compete with the CPU for the RAM access and could not keep up the sampling uniform. The key to resolving this was to optimize the memory access patterns of the compression algorithm. Having them spaced far enough apart and lowering the sampling frequency to allow the CPU to keep up brought back very precise sampling at a rate of 6.2-8.4MHz for most boards.
Something in-between
Using the CPU to compress the signal in real time took a heavy toll on the sampling frequency, so we decided to add a mode that will combine the fast sampling frequency and the ability to capture the interesting part of the signal. The classical triggered mode (capturing the data around a chosen event) solved the problem but presented new challenges: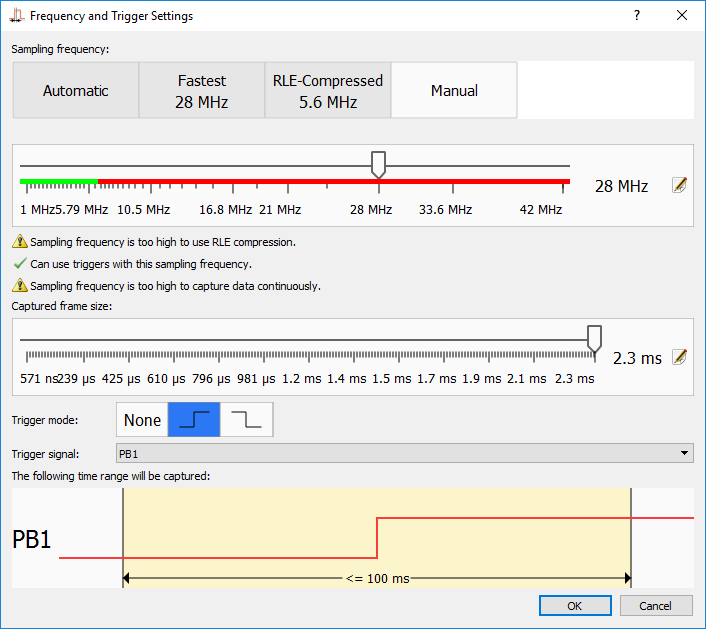
Checking for the trigger would mean not stalling the CPU while the capture was active, and that undoubtedly disrupted the uniform capture pattern. The solution here was to use the external interrupt controller and carefully timing the memory access patterns of the interrupt-related code to avoid interference with the sampling. The result was worth the effort: for most of the boards the triggered mode was significantly faster than the compressed mode. We also added trigger support for the compressed mode that works with slightly lower sampling frequencies.
Continuous mode
Being inspired by the sampling quality in the compressed mode, we decided to try another idea: how far can we go if we setup 3 processes in parallel: sampling the data, compressing it and transferring the compressed part to the computer non-stop? The result was surprisingly good: lowering the sampling frequency to ~6MHz for the fastest boards and playing around with memory access patterns got precise non-stop sampling, so we could record hours of non-stop activity on slower buses like I2C not being limited by the on-chip RAM anymore.
Usability
Having the capture modes figured out and the firmware optimized, we faced the final challenge: how to make a logic analyzer software that will be intuitive, easy to use and scalable at the same time. So we created an tool for viewing the captured signals and started analyzing some real-world hardware interactions and figuring out how to make the process as user-friendly as possible. So here’s what we have found:
Setup and Live Streaming
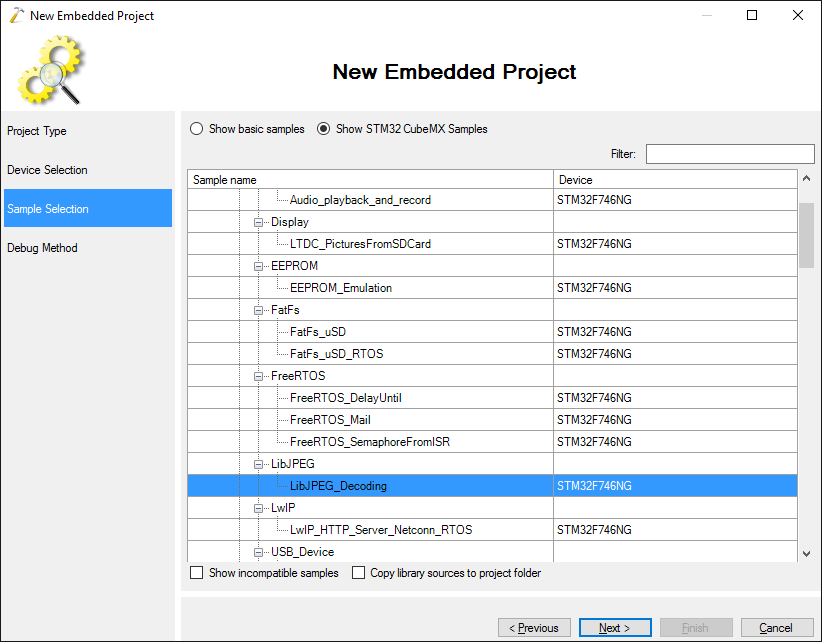
We wanted to make the process of starting the analyzer and beginning to view signals as easy as possible. If you are concerned why your SPI is not working properly, you probably don’t want to be distracted by downloading the board schematics to figure out how to connect it, or seeing why the ST-Link driver is not being recognized. So we designed the viewer application to be as straight-forward as possible. So after the board is connected and selected in the list, it shows the picture of the board and highlights the signals that can be used as inputs: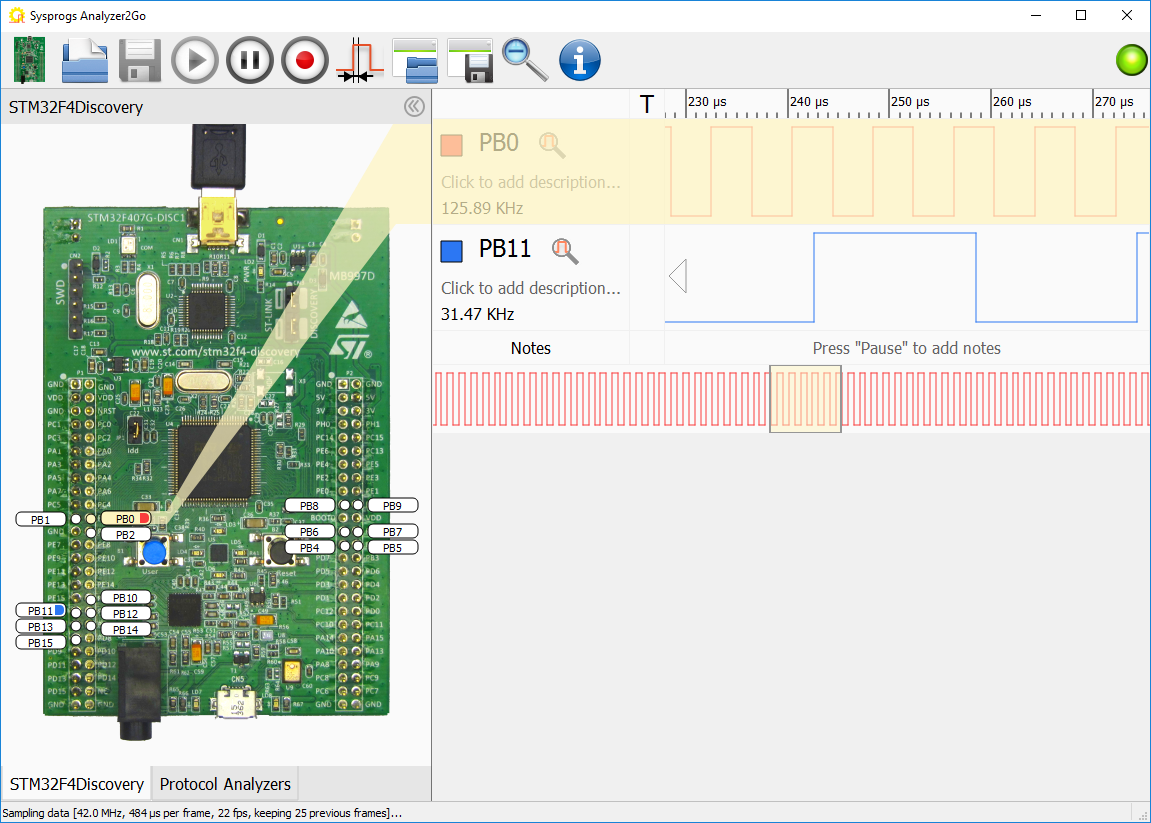
Clicking at the signals immediately adds them to the live view, beginning to show the current signal. The frequency is chosen automatically (unless set manually) by first trying to sample the signal as fast as possible, and if it looks slow enough, retrying in the compressed mode.
Viewing Data
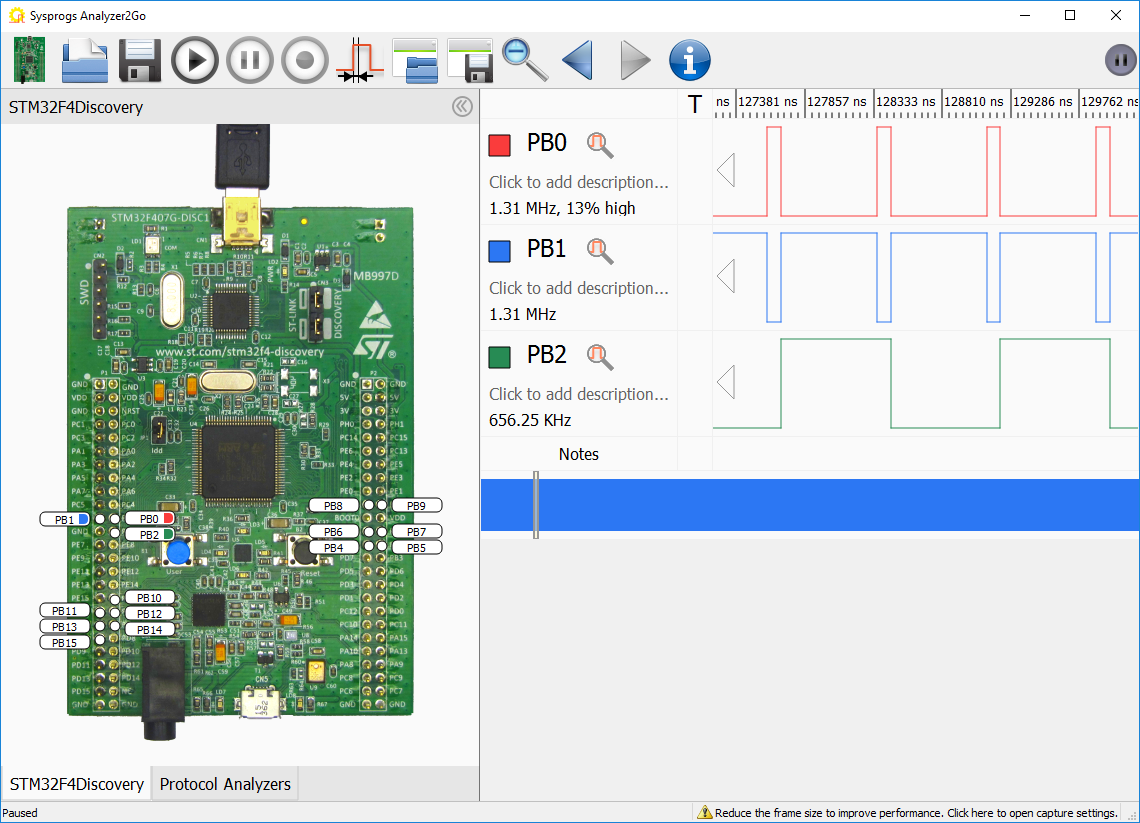
One of the first important things we figured out was the importance of easy signal labeling. Having to keeping mind that PB0 is the red cable connected to the SCK signal does not make things easy. So we have added an intuitive way of specifying the signal colors and labels:
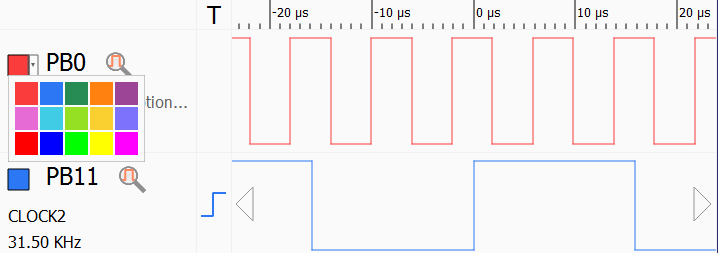
We also added a “trigger” column that allows enabling and disabling triggers by just clicking on the corresponding signal as a quick alternative to going deep into capture settings.
While trying to explore several real-world bus interactions, we quickly found that while the clocked buses are easy to observe, counting the pulses and translating the signal view to ones and zeroes is annoying, so we added a special clocked view mode that is activated by selecting a signal that looks like a clock and clicking on the “set as primary clock” button: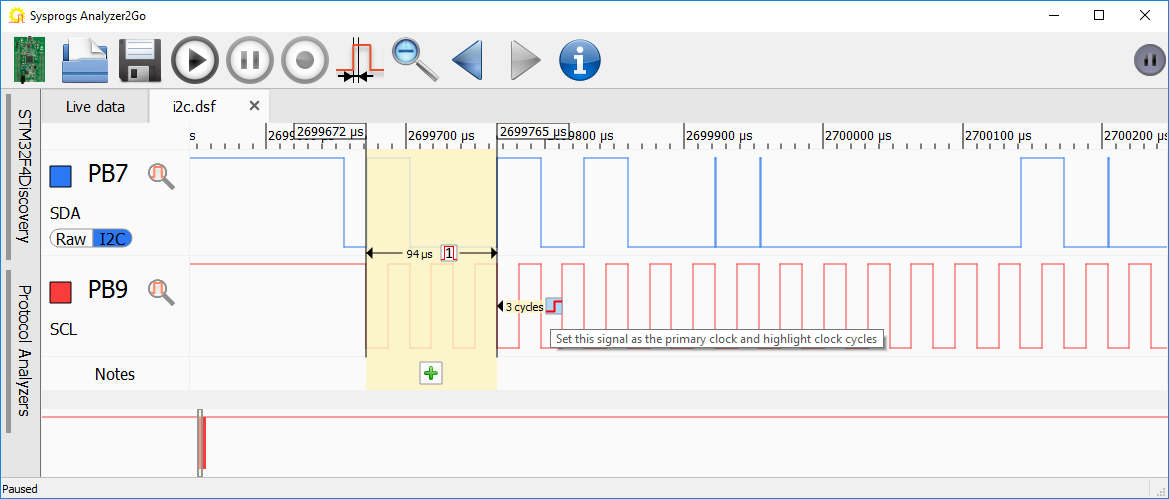
This will split the selection into intervals aligned at the clock edges and will automatically annotate all other signals with ‘0’, ‘1’ or ‘X’ depending on their value during that clock cycle: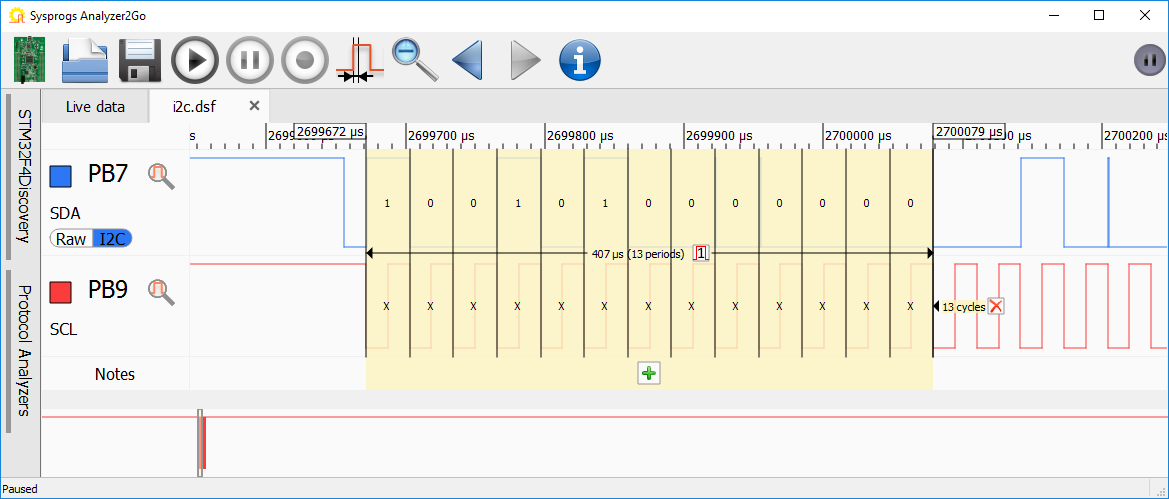
We also added a similar mode for the asynchronous signals where the selection is split based on time instead of clock edges.
Notes
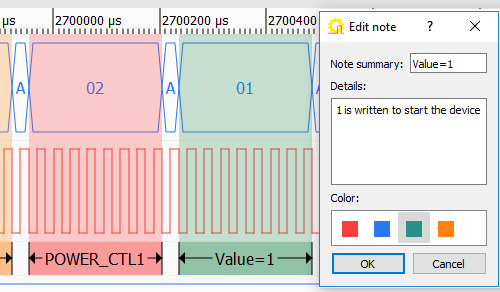
Another time-consuming process while trying to understand some complex bus interactions was to keep track when one of the transaction ends and another part begins. If the captured frame contained several similar packets, navigating between them and keeping in mind where each part starts could be tricky. So we added a mechanism for annotating arbitrary points in time with color-coded labels and arbitrary descriptions: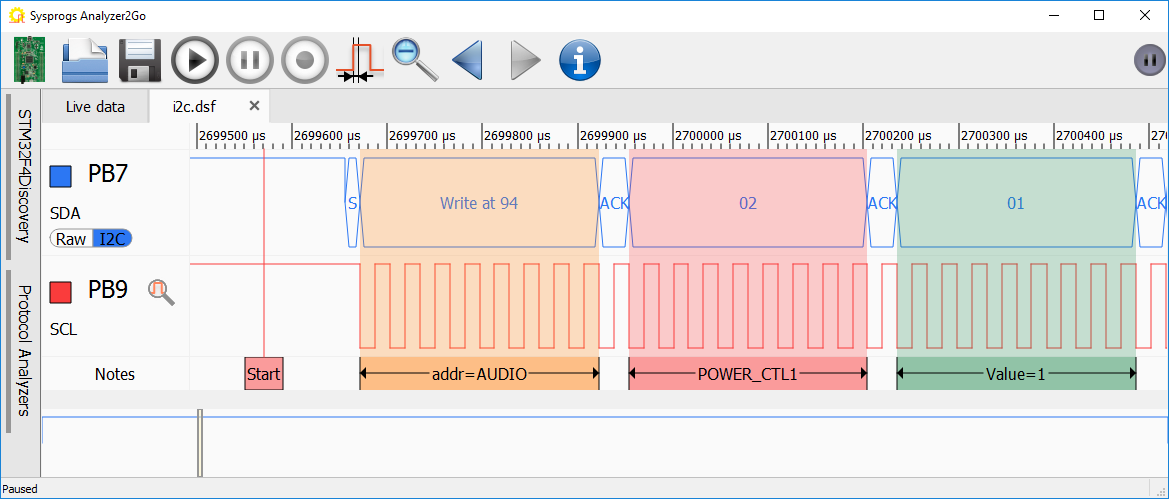
Notes can also be used to quickly navigate between events in a large capture file: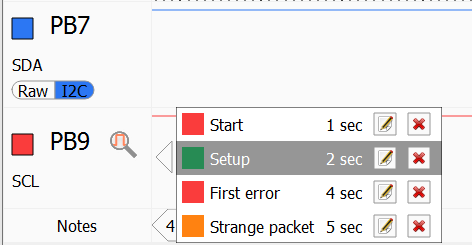
Protocol Analyzers
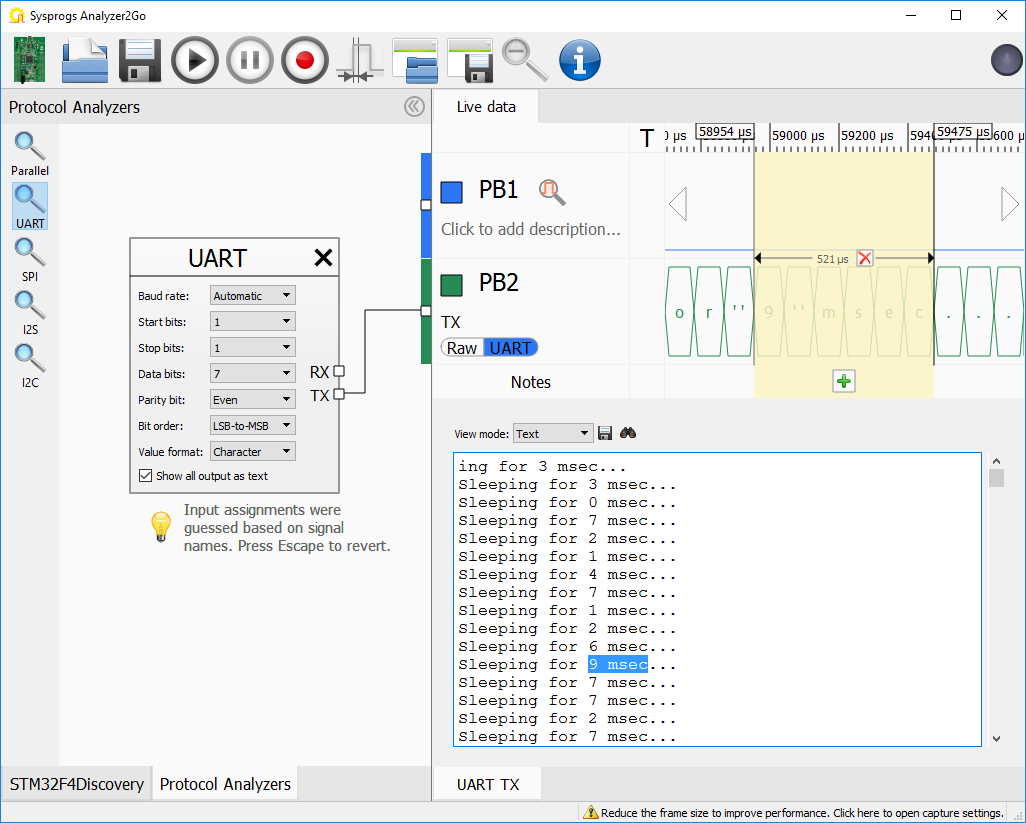
We have also added automatic analyzers for commonly used protocols like UART, SPI, I2S and I2C. Dragging them to the protocol analyzer panel and connecting the inputs automatically replaces the raw view with a higher-level view showing the decoded data: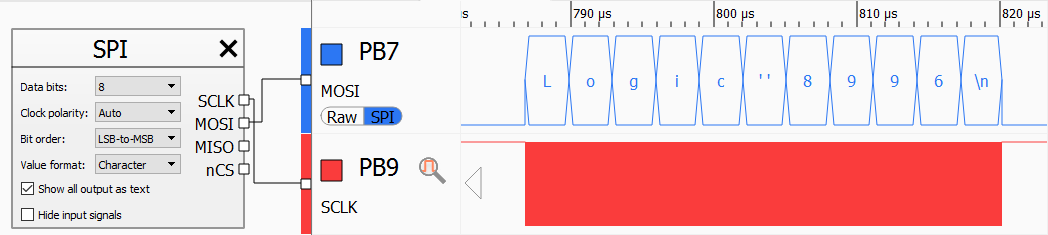 Playing around with the protocol analyzers, we quickly discovered another challenge: displaying the decoded bytes in place of the original signals can only show a small amount of text before it gets zoomed out too much and decoding everything as text makes it hard to see the timings and values of other signals.
So we have combined the best of both approaches by adding the “text view” pane:
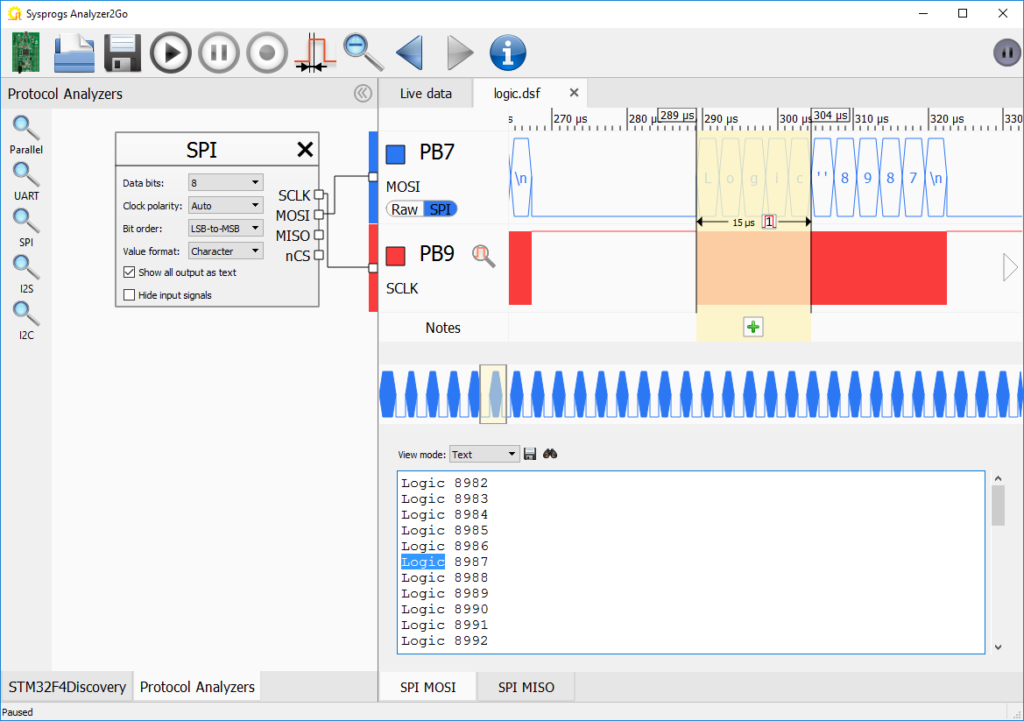
The pane shows all the decoded output from the entire frame (or file), allows browsing through it and doing full-text searches and it’s automatically synchronized with the timing view: selecting some characters in the text view will automatically select the corresponding time range and selecting a time range will highlight the characters belonging to it.
Continuous Capture Files
Being able to capture data continuously at ~600KB/s was great, but it presented another challenge. Several minutes of capturing can produce hundreds of megabytes of data and instantly navigating through it, zooming in and out, especially while the recording is still in progress, is tricky. So we designed a special capture file format using a technique roughly resembling image thumbnails that allows looking (and searching) through a huge file while it’s being captured, instantly opening and analyzing large files and remembering notes and protocol analyzer settings when you reopen the file later: 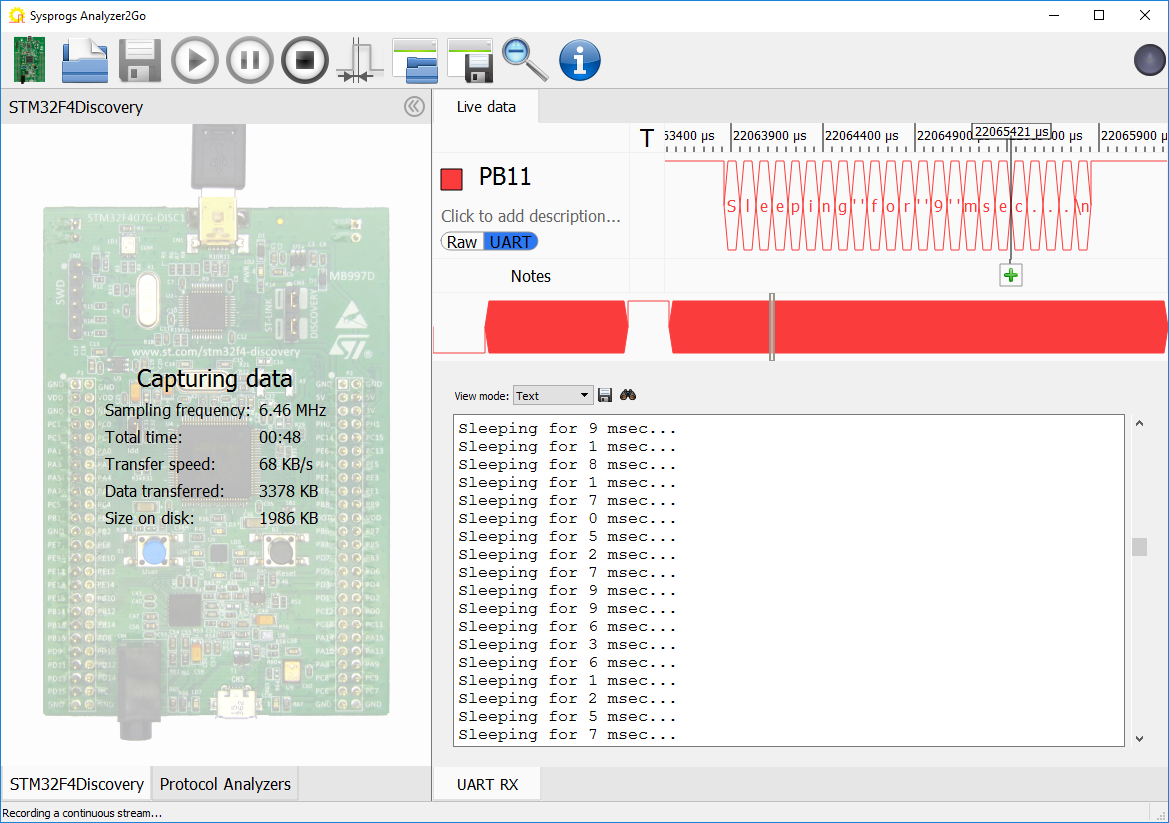
Try it out
After months of resolving hardware and software challenges and tweaking the usability, Analyzer2Go was born. It currently supports 8 popular boards from ST and runs on Windows. Support for more boards and other operating systems is coming soon.
The next step
The hardware is capable. The software is mighty. So go ahead and send us your feedback and suggestions for new boards to support and we will turn your board into a reliable and easy-to-use logic analyzer next!