The upcoming VisualGDB 5.2 comes with several improvements to the Clang IntelliSense engine that make the development experience easier and save time on common tasks. Let’s look at those in detail.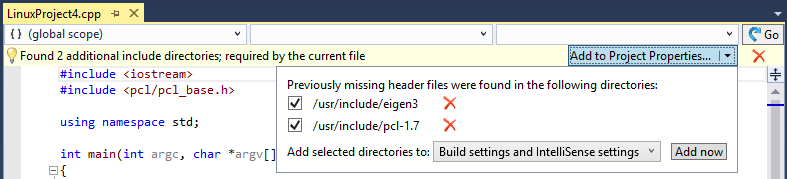 Continue reading Clang IntelliSense improvements in VisualGDB 5.2
The New Dependency View in Embedded Memory Explorer
Embedded Memory Explorer is one of the most loved Embedded features of VisualGDB. It helps you keep track of the FLASH and RAM used by your embedded project so you can be sure that your program fits into your device memory: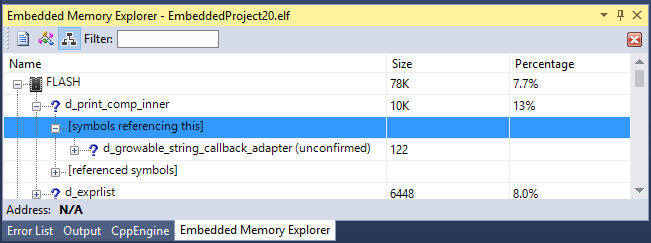 The new VisualGDB 5.2 comes with a feature that makes this window even more efficient at finding out why is your program bigger than you wanted it to be. Continue reading The New Dependency View in Embedded Memory Explorer
The New Advanced Memory Window in VisualGDB 5.2
One of the topics that got us a lot of feedback recently was the poor performance of the Visual Studio Memory window with embedded VisualGDB projects. Two main problems reported by our users were lack of memory view when the program is running and the fact that it tried reading a wider memory area that was actually displayed, sometimes causing the underlying tools to crash. We have solved that in VisualGDB 5.2 with a brand new Advanced Memory Window specifically designed for maximum usability with VisualGDB projects.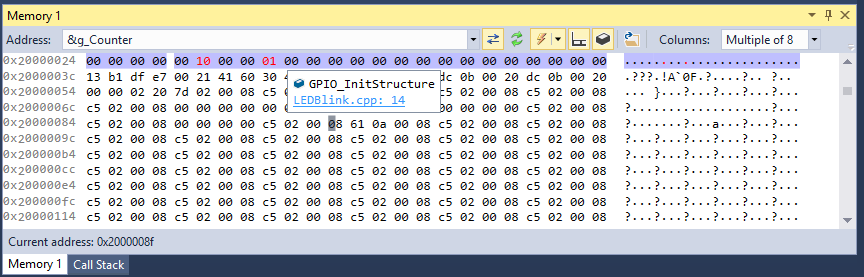
Continue reading The New Advanced Memory Window in VisualGDB 5.2
Extending the VisualGDB Test System
The new system for running C++ Unit Tests added to VisualGDB 5.2 has out-of-the-box support for CppUTest and GoogleTest framework. But it’s also designed to be easily extendable to support any other test framework through a flexible set of rules defined in XML files. This post will describe how the test frameworks are defined and what can be customized in the framework definitions to support more frameworks.
The New Unit Test Support in VisualGDB 5.2
One of the new features introduced in VisualGDB 5.2 is the seamless integration of C++ unit testing frameworks into Visual Studio. VisualGDB supports the CppUTest and GoogleTest frameworks for Linux, Android and Embedded projects out-of-the-box and also comes with a powerful customization mechanism that allows describing any other test framework in a way that will allow VisualGDB to discover and run tests from it with just a few mouse clicks.
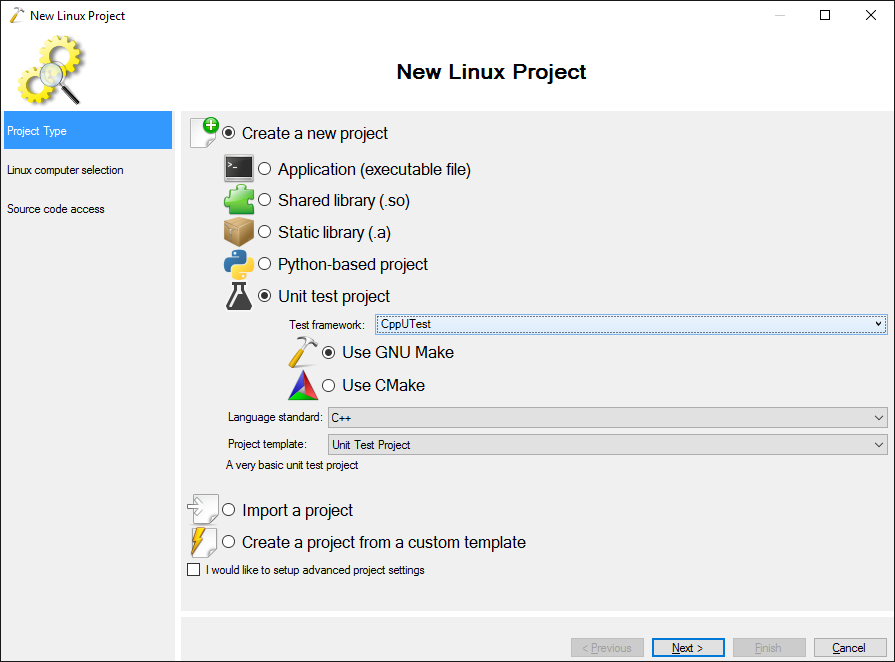
Let’s look into the new unit test system in detail.
Continue reading The New Unit Test Support in VisualGDB 5.2
VisualGDB 5.0 Beta 3 is out
We have released VisualGDB 5.0 Beta 3! This release focuses mainly on usability features for embedded projects that have been requested by the community.
First of all we have added support for live variables – a convenient way to inspect the global variables in your program without stopping it. VisualGDB supports real-time plotting, data breakpoints and can export the data to CSV: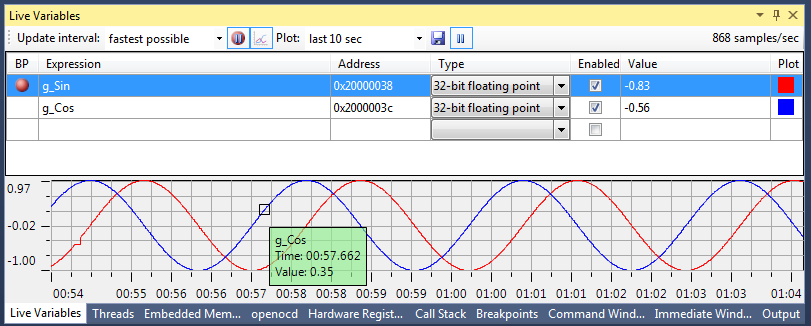
Continue reading VisualGDB 5.0 Beta 3 is out
About Android toolchains and system images
Native Android debugging has always been somewhat tricky. In addition to common source path issues and random gdbserver failures, many VisualGDB users reported that they can debug code on their device only if they use certain versions of NDK toolchains. To figure it out once and for all we have added a VisualGDB feature that allows testing a certain Android device with all the toolchains available in the NDK. To get a general overview we have tested the standard ARM emulator images that come with the Android SDK.
Continue reading About Android toolchains and system images
SmarTTY 2.0 is out
We have released a new version of SmarTTY, our free multi-tabbed SSH client. The new release focuses on improving usability and making common scenarios simpler. Let’s overview the main features of the new release:
Continue reading SmarTTY 2.0 is out
VisualGDB 5.0 Beta 1 – Refactoring and C++ CodeMap
After several preview builds of VisualGDB 5.0 with the new Clang-based IntelliSense engine introducing features from precise code suggestions to fast find-all-references, we are now proud to release the first beta of VisualGDB 5.0. The beta adds a few more features targeted at C++ development productivity:
- CodeMap for C++ (requires VS2012+, but also works on the free Community Edition)
- Advanced renaming
- Intuitive refactoring
Let’s have a detailed look at those new features.
Continue reading VisualGDB 5.0 Beta 1 – Refactoring and C++ CodeMap
Exploring code with VisualGDB 5.0 Preview 4
We have recently released a new preview build of VisualGDB 5.0 featuring a new Clang-based IntelliSense engine. This preview build focuses on greatly improving the experience with navigating large code bases. In this post I will show how to quickly analyze the code structure and navigate in 2 large codebases:
- The source code of clang itself (~30MB of C++ sources)
- The source code of the Linux Kernel (~420MB of C sources)
Continue reading Exploring code with VisualGDB 5.0 Preview 4