We have just added support for the new ESP32 chip to VisualGDB. While VisualGDB allows building projects, setting breakpoints and debugging your ESP32 code out-of-the-box, the ESP32 tools come with a few known limitations that may interfere with debugging. In this post I will summarize them and show known workarounds.
Reset behavior
The biggest problem of the ESP32 chip is that it cannot be reliably reset into a predictable initial state. Programming the SPI FLASH requires putting the chip in a state where the background tasks are stopped, FLASH is initialized properly and the interrupts are disabled. Unlike ARM devices that enter this state immediately after reset, ESP32 does not allow doing it easily. Resetting just the CPU leaves the peripherals in an unpredictable state that often results in a crash and resetting the entire chip immediately starts the CPU, so by the time VisualGDB can stop it, it has already begun running some code.
VisualGDB works around this by doing a chip reset and halting both CPUs some time after it, but this does not work 100% reliably.
If you encounter a situation where your FLASH memory cannot be programmed, try the following steps to troubleshoot it:
- Put the chip in the bootloader mode (hold the bootloader button, press the reset button).
- Start JTAG debugging. The memory should get programmed, but the chip will not leave the bootloader mode without a physical reset.
- Reset the chip by pressing the Reset button.
- Select “do not program FLASH” in VisualGDB Project Properties and start JTAG debugging again
Breakpoints in FLASH
The ESP32 chip has only 2 hardware breakpoints. This means that you cannot set more than 2 simultaneous breakpoints in the code that resides in the SPI FLASH. To work around this you can move some of your functions from FLASH to RAM:
void __attribute__((section(".iram1"))) ramfunc() { //... } |
VisualGDB will automatically detect the code that is placed in RAM and will use software breakpoints instead of hardware ones for it.
Breakpoints in RAM
Unlike ESP8266 where software breakpoints in RAM just work, the ESP32 makes things a bit trickier due to having 2 cores. They will work flawlessly if they are triggered on the same core that was active when setting them. If a different core triggers a software breakpoint, OpenOCD will not handle it correctly will display it as a random stop in a random place: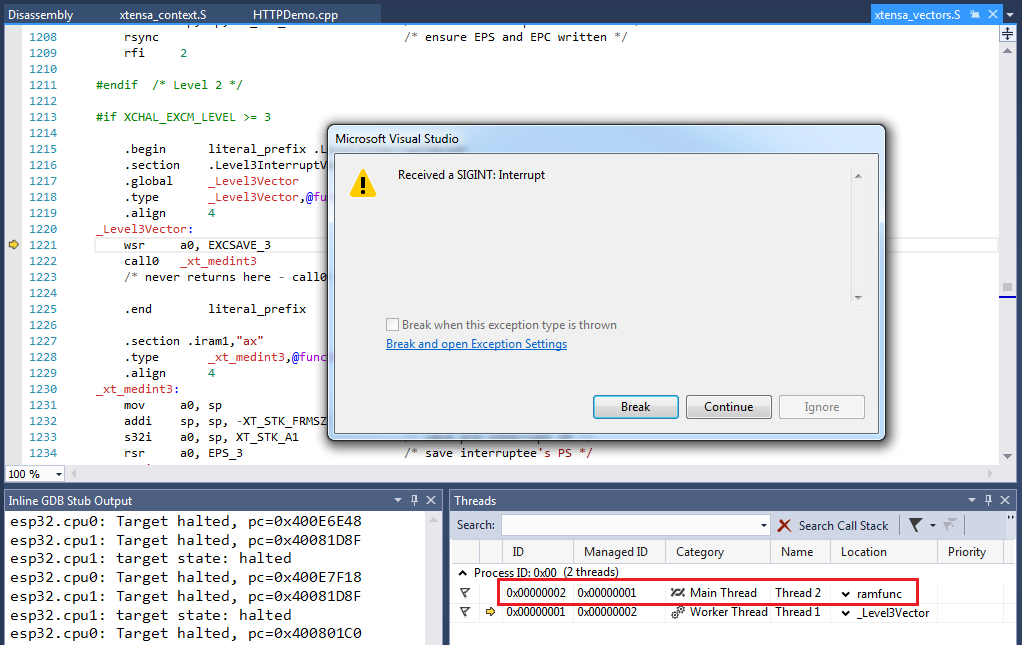
Although this is annoying, it does not mean the end of the world. You can switch to the other core via the Threads window in Visual Studio and see the code that triggered the breakpoint: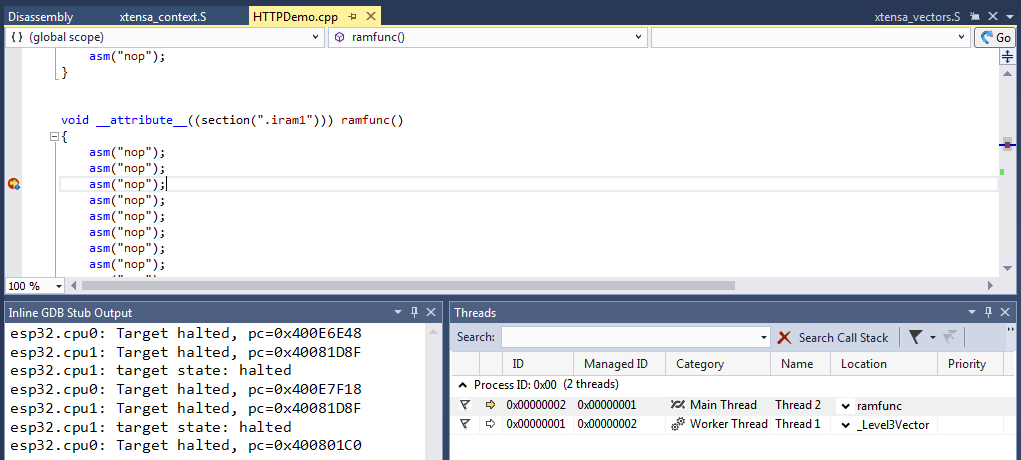
Viewing local variables and call stack will work, but trying to continue debugging will result in a random effect from stopping at the same place in code to crashing gdb. The workaround would be to disable the breakpoint, optionally set another on on the next line, resume execution with F5 and reenable the original breakpoint once the next breakpoint is hit.
We have experimented with modifying OpenOCD to report the correct core in the ‘session stopped’ event, but this often results in crashing the firmware, so as of November 2016, the core that triggered the breakpoint needs to be selected manually.
Stepping into functions does not work
This is another unfortunate limitation of the ESP32 GDB. Trying to step into and over function calls often ends up with just resuming the execution. The workarounds that work are:
- Set a breakpoint on the next line and press F5 instead of trying step over (beware of the breakpoint count limit)
- Switch to the Disassembly View and step instruction-by-instruction if you want to step into a function
The firmware sometimes crashes randomly
VisualGDB does a lot of background work to keep debugging as usable as possible. Stopping watchdog timers, disabling interrupts during stepping, distinguishing RAM and FLASH functions… Despite that, debugging sometimes does interfere with some ESP32 internals, causing the firmware to throw one exception after another. The fastest shortcut out of this state is to use the “Reset Device” button in the GDB Session window: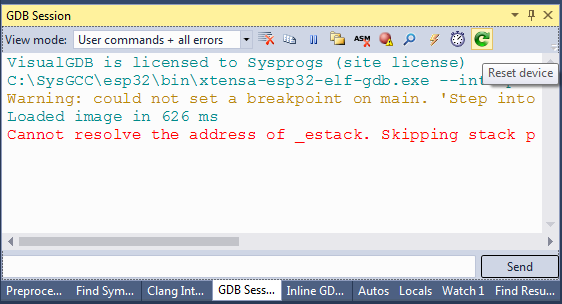
Some CPU registers are shown incorrectly
Yet another bug of the ESP32 gdb/OpenOCD is incorrect reporting of some of the CPU registers. If you see invalid values shown in Visual Studio, use the “mon reg <register name>” command to query the correct one directly from OpenOCD: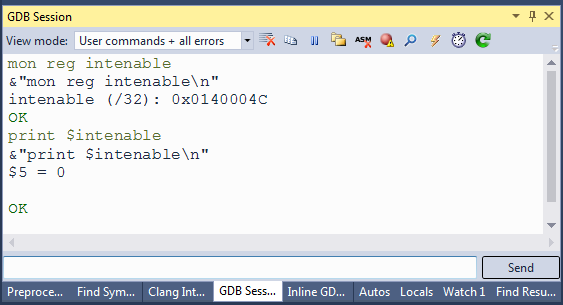
Stepping through code sometimes crashes gdb
Stepping through code with inline functions may crash gdb with the following message:
../../../../src/gdb-7.10/gdb/inline-frame.c:167: internal-error: inline_frame_this_id: Assertion `frame_id_p (*this_id)' failed. |
The suggested workaround is to disable function inlining for the source files you are debugging.
Next steps
Despite the few shortcomings shown here, Espressif has done a great job open-sourcing most of the ESP32 libraries in the ESP-IDF framework and providing an OpenOCD version that can provide basic debugging functionality. The version shipped with VisualGDB contains a few stability improvements over the original one and can be found in our Github repository. We will be contacting Espressif regarding the issues in the ESP32 tools and will post updates here once better workarounds are available.