Embedded Memory Explorer is one of the most loved Embedded features of VisualGDB. It helps you keep track of the FLASH and RAM used by your embedded project so you can be sure that your program fits into your device memory: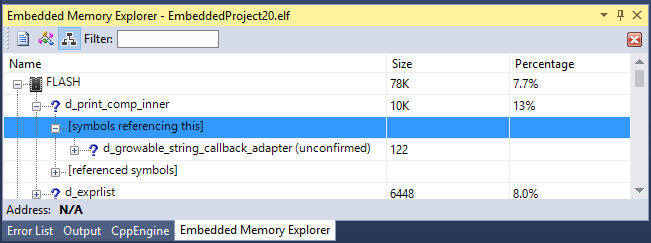 The new VisualGDB 5.2 comes with a feature that makes this window even more efficient at finding out why is your program bigger than you wanted it to be.
While being precise and clear about where your memory went, the Embedded Memory Explorer of VisualGDB 5.1 and earlier did not answer the more important question why. Let’s look at a basic example: turn off the “Reduce size of C++ binaries” feature and add a basic C++ class with a virtual method to your embedded program:
class Base { public: virtual void test() = 0; }; class Some : public Base { public: virtual void test() override { } }; int main(void) { Some thing; } |
If you compile this, you may make a shocking discovery that adding nothing more than one empty method suddenly bumped up your FLASH usage by 75 KB: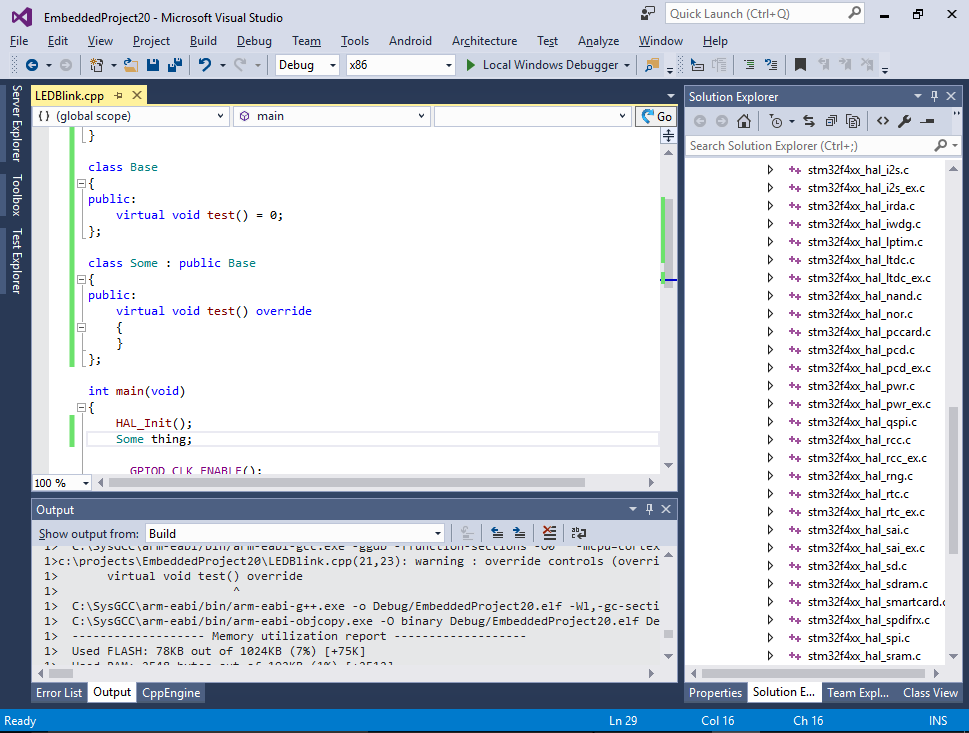
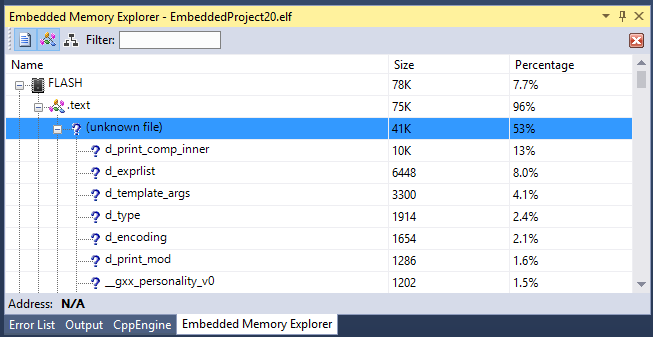
While being unnoticeable on Linux or Android, this could be a killer if you are targeting an embedded device with the FLASH size measured in tens of kilobytes. The normal Embedded Memory Explorer will quickly reveal that most of the memory is now used by some library code that you never called explicitly:
Before VisualGDB 5.2 that would mean an annoying search through the disassembly output to figure out who calls d_print_comp_inner(), then who calls its caller and so on. Thankfully there is a simpler way. The GCC compiler used by VisualGDB can be instructed to generate the so-called relocation records used by your operating system when it decides move your program to a different location in memory and needs to update references to all the functions. While normally useless for the barebone embedded applications, they provide an (almost) complete list of places where each function is referenced (except some internal library functions). VisualGDB now utilizes this to show all functions referencing a given symbol and explain why it was included into your program.
You can enable this mode by clicking the corresponding button on the Embedded Memory Explorer toolbar. If you are doing this for the first time, VisualGDB will enable the relocation record generation and will ask you to rebuild the project. Then you will quickly see why each of the strange functions was included. In our example the roots of the d_print_comp_inner() trace to the default implementation of std::terminate() called by the default implementation of the pure virtual method that can be accidentally invoked from the abstract class constructor before the child class was fully initialized: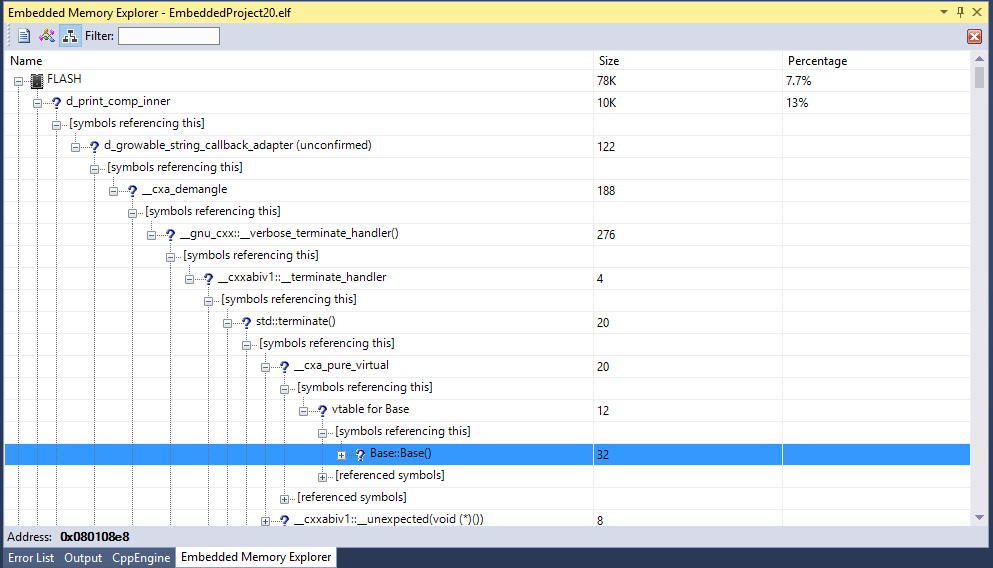
While producing a neat stack trace in that case could be meaningful on Linux, it is not worth the extra memory on small Embedded targets. The solution in this case would be to replace __cxa_pure_virtual() with something more compact that will for example just trigger a breakpoint. The “Reduce size of C++ binaries” option does exactly that as you can quickly check with the new Memory Explorer: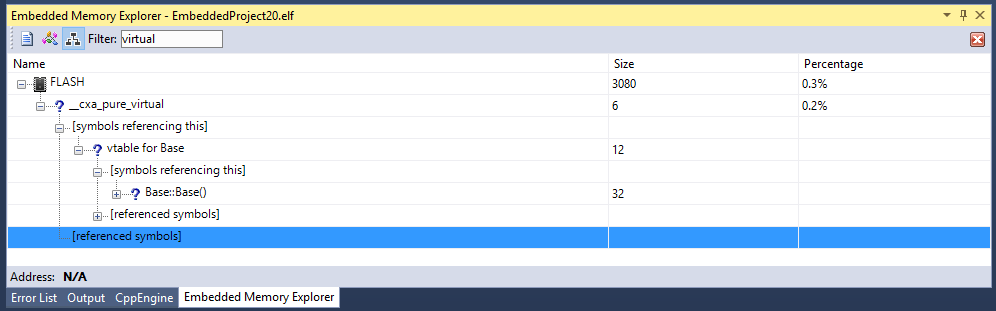 You can download the latest VisualGDB supporting this feature on the download page.