One of the topics that got us a lot of feedback recently was the poor performance of the Visual Studio Memory window with embedded VisualGDB projects. Two main problems reported by our users were lack of memory view when the program is running and the fact that it tried reading a wider memory area that was actually displayed, sometimes causing the underlying tools to crash. We have solved that in VisualGDB 5.2 with a brand new Advanced Memory Window specifically designed for maximum usability with VisualGDB projects.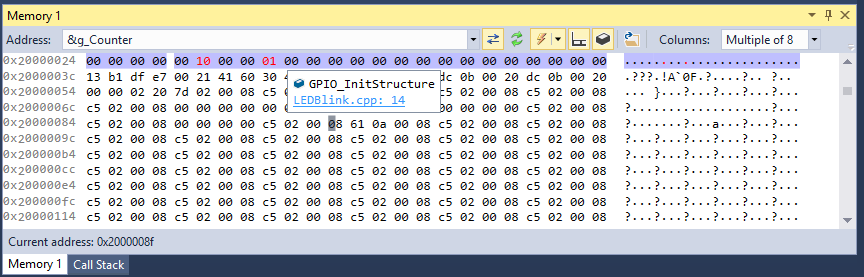
The new window is a drop-in replacement to the regular one. First time you open a Memory window with VisualGDB 5.2, it will ask whether you want to use the regular one or the advanced one. If you see that question, be sure to pick the advanced one because here’s the list of improvements we made to it:
- The new window only reads the memory you want to see, nothing more, so the gdb stub won’t crash suddenly because you approached an unreadable memory region.
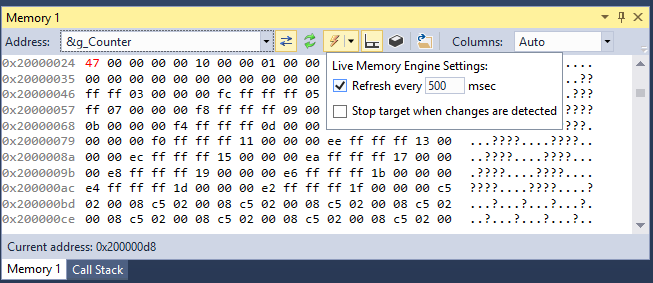
- You can switch between using the regular GDB commands or using the live memory engine used for Live Variables. The latter is much faster and can display the memory contents while the program is running. You can also configure it to auto-refresh the contents periodically and even stop your program if changes are detected.
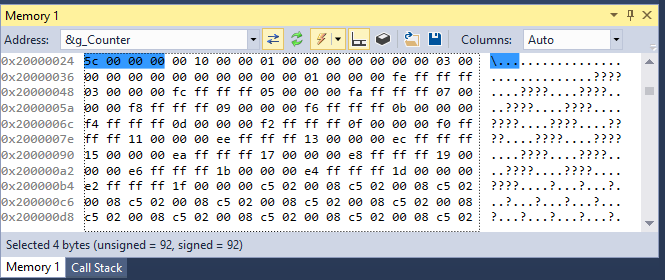
- We’ve added a status bar showing the address of the currently selected text, and the size of the selected area. If you are viewing the memory as an array of integers or floating-point numbers, it will also display the minimum/maximum/average values for your convenience.
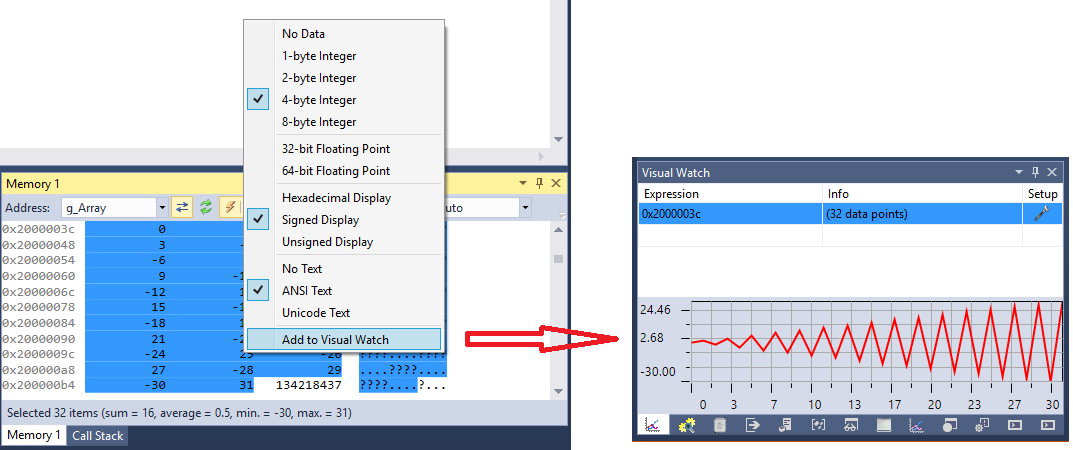
- The new window is fully integrated with the Visual Watch and Live Variables. A couple of mouse clicks will quickly get a selected memory area plotted as a graph with the type and size automatically derived from your selection:

- We’ve added buttons for saving selected area to a binary file and for reading it back into the target memory.
- Finally we have added a special annotation mode where the Memory Window will search the shown region for global variables and functions and will highlight them. Hovering your mouse over the contents of a function or variable will display a hint allowing you to quickly open its definition:
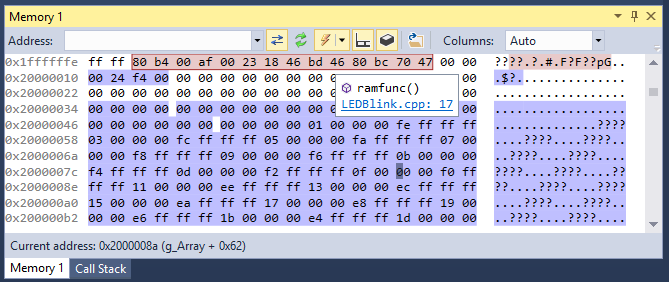 This also works for stack frames: if the viewed memory region approaches the stack pointer, VisualGDB wil query gdb debugger for the bounds of the stack frames and will highlight them in the Memory window:
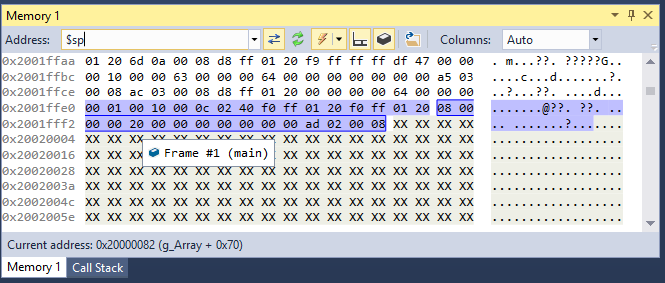
You can download the latest VisualGDB with the new advanced Memory window on the download page.