Today we are excited to announce a new product that makes embedded development a bit easier.
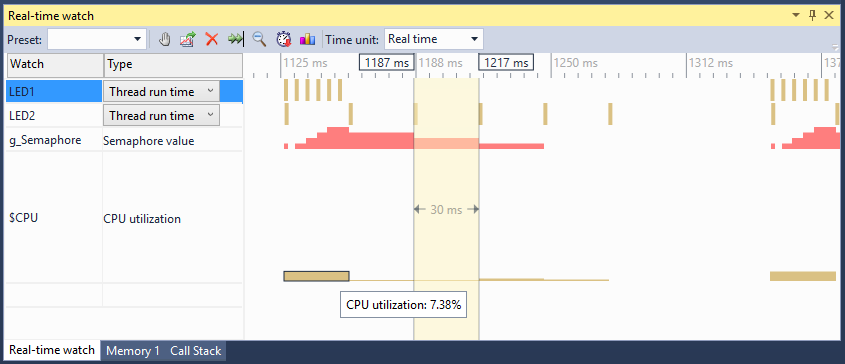
It is the further evolution of the real-time watch feature that allowed the users of VisualGDB to see the precise timings of their code by automatically instrumenting it. With Analyzer2Go we took this approach even further – now you can use your development board to record, save and analyze digital signals in your design without no special logic analyzer hardware.
We designed Analyzer2Go to be extremely easy-to-use. It will automatically locate your board, install the necessary drivers and upload the necessary firmware. All you need to do is click on the signals on the board picture to immediately see a live data feed: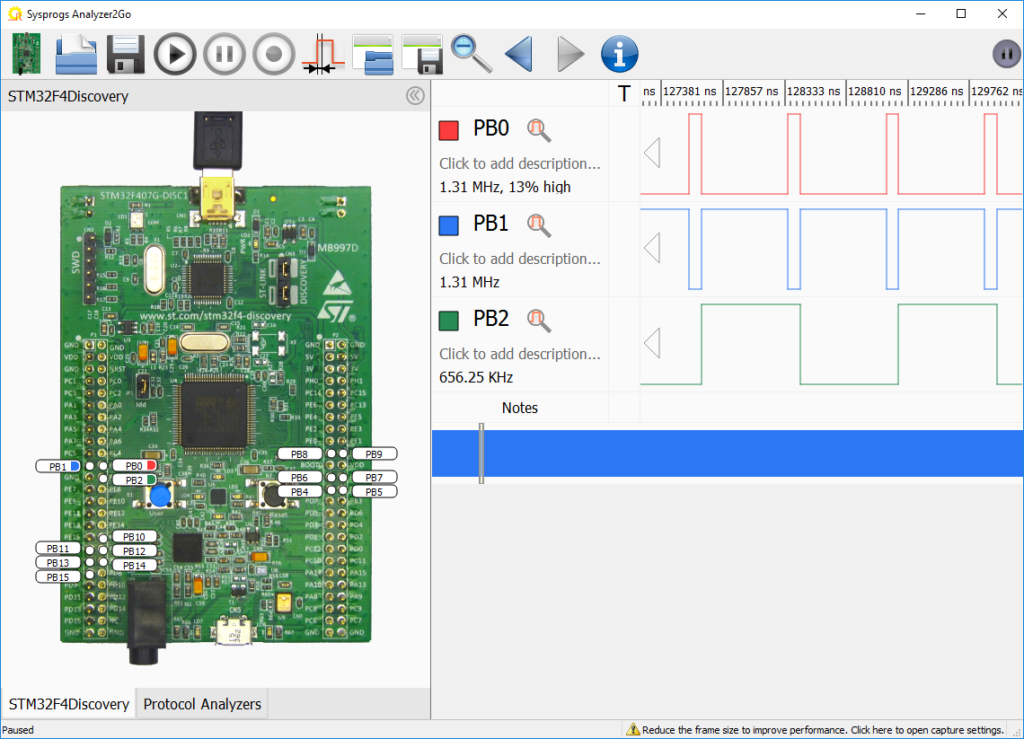
The Analyzer2Go firmware uses a thoroughly optimized DMA-based capture mode that allows sampling signals at high speeds (e.g. up to 72 MHz on STM32F746-Nucleo) and ran rigorous tests to ensure that the sampling is always properly timed.
We have designed Analyzer2Go to be intuitive and help you focus on the signals you are exploring instead of fighting the tools. Easy navigation for sparse signals, automatic zooming, powerful preview bar, previous frame history, so you can always roll a few frames back if your eye caught something suspicious… We have even added a note mechanism that allows you to easily place color-coded notes attached to different events and time spans, so you can keep a track of the meaning of the observed signals and not just their shape: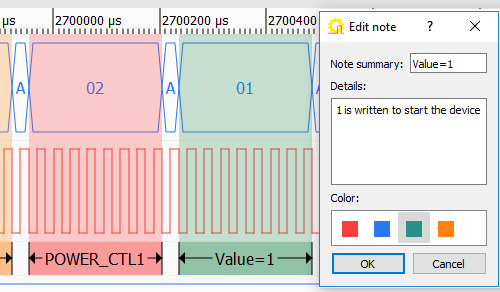
For slower signals we added a special continuous capture mode that can record gigabytes of logs continuously into a special optimized format that allows opening and browsing through them quickly no matter how large the log is.
To make it even more fun, we added easy-to-use drag-and-drop protocol analyzers for the UART, SPI, I2S and I2C protocols that support full-text search (optimized fur huge files, of course) and can automatically synchronize the timing view with the decoded data view: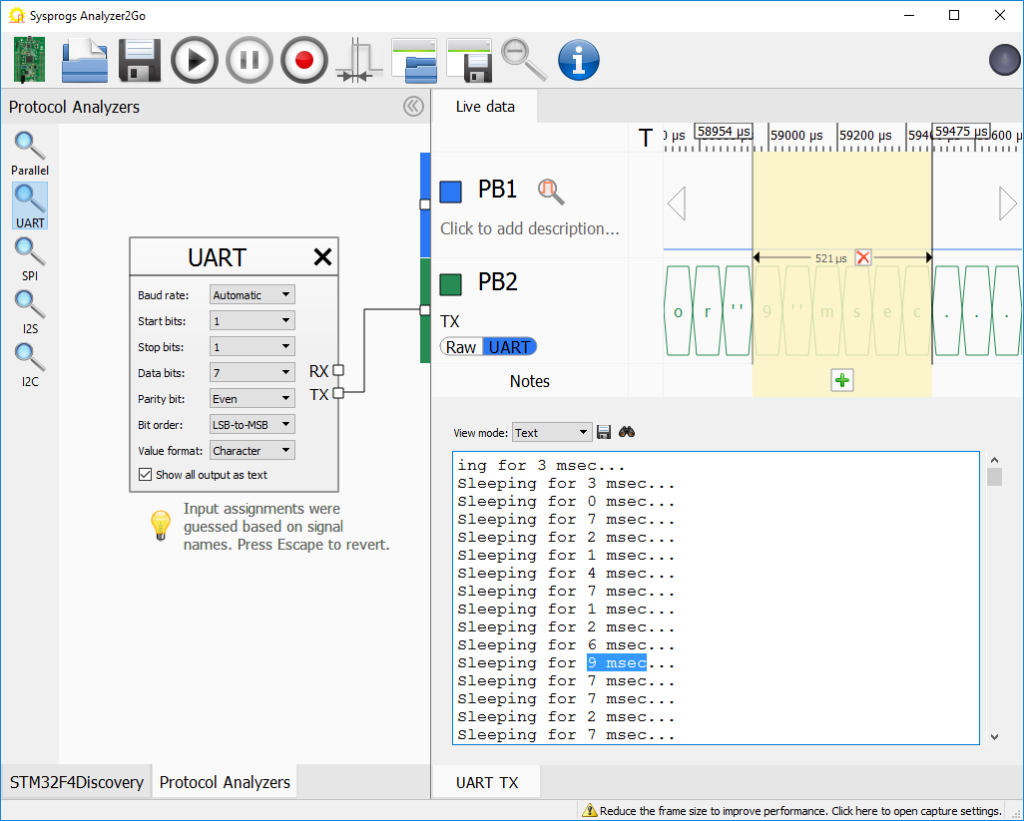 Analyzer2Go currently supports 8 popular development boards from ST and we are planning to add support for more.
You can download it here and browse through some step-by-step tutorials on this page.
As always, we will be happy to hear your feedback and suggestions, so feel free to reach as via our support page. Enjoy!
