One of the topics that got us a lot of feedback recently was the poor performance of the Visual Studio Memory window with embedded VisualGDB projects. Two main problems reported by our users were lack of memory view when the program is running and the fact that it tried reading a wider memory area that was actually displayed, sometimes causing the underlying tools to crash. We have solved that in VisualGDB 5.2 with a brand new Advanced Memory Window specifically designed for maximum usability with VisualGDB projects.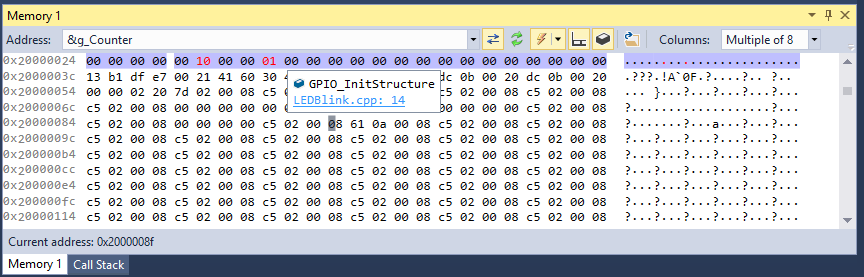
Continue reading The New Advanced Memory Window in VisualGDB 5.2