All posts by Ivan Shcherbakov

Introducing Code Explorer

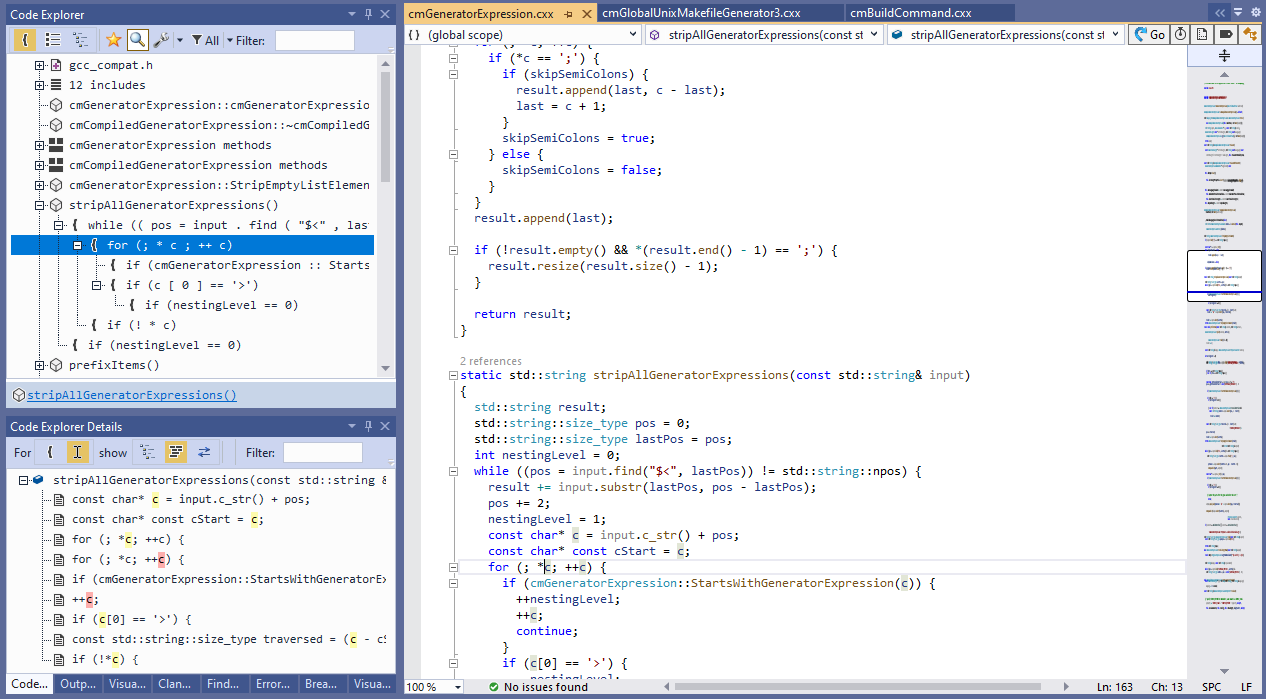
One of the major design goals of VisualGDB is to help our users easily navigate large C/C++ code bases. This is possible due to our heavily optimized Clang-based IntelliSense engine, that can replace the regular VC++ IntelliSense for VisualGDB projects. It uses multiple threads to fully analyze the entire codebase and build a detailed map of your classes, functions, methods, and relations between them. This has enabled features like CodeJumps and integration with Visual Studio’s Code Map.

VisualGDB 5.6 introduces another feature that will save you time dealing with large projects: Code Explorer. And in this post I will give you a tour of its main highlights. Continue reading Introducing Code Explorer

Announcing Visual Studio 2022 Support

When Microsoft first announced that the upcoming Visual Studio 2022 is moving to 64 bits, they caught us by surprise.  Microsoft products are known for great backward compatibility, but that comes with a hefty cost of keeping alive numerous interfaces and technologies introduced several releases ago. Native components have to work side-by-side with managed components. COM interfaces have to work together with MEF interfaces. Legacy synchronous API should not break the new asynchronous one.

And to my great pleasure (and to Microsoft’s credit) they have done a tremendous job moving the unimaginably complex Visual Studio environment the x64 platform. Sure, it did require some changes on our side, but the overall process went much smoother than I could have anticipated.

What it means for our users, is that VisualGDB is now fully compatible with Visual Studio 2022 Preview. Simply download VisualGDB 5.6 Beta 4 and it will automatically detect your VS2022 installation and will integrate with it, so you can keep enjoying the best of both VisualGDB and Visual Studio without any distractions.


VisualGDB 5.6 Beta 3 is out

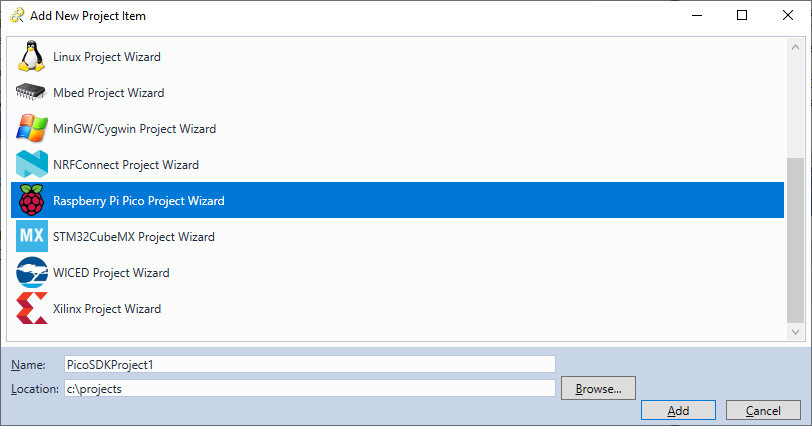
Today we are proud to announce the release of VisualGDB 5.6 Beta 3. This version introduces the ability to directly debug the PIO module of Raspberry Pi Pico, adds support for custom debug setups, increases the stability of the Xilinx Vitis integration, and contains numerous other improvements. In this post I will give you a overview of the main features introduced in this release.

Continue reading VisualGDB 5.6 Beta 3 is out

Live Non-Intrusive Debugging of Real-Time ARM Targets

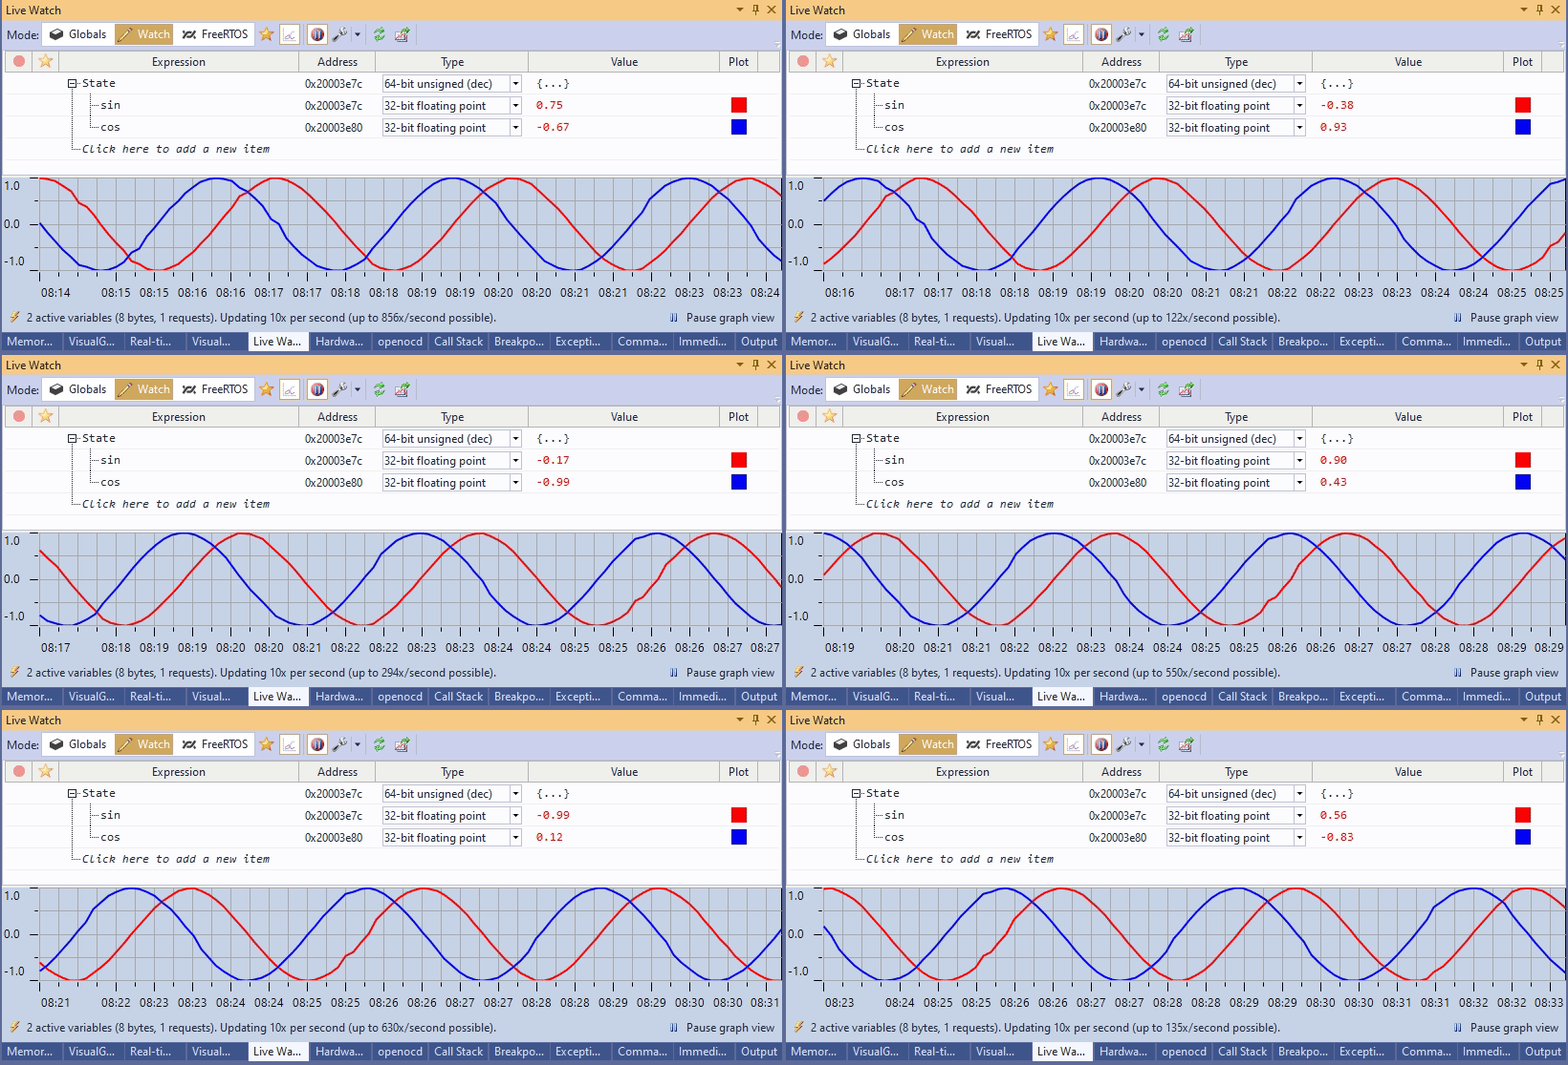
Have you ever tried debugging a beefy IoT-enabled chip connected to the world via Wi-Fi, Bluetooth, Ethernet, or even a good old boring CAN bus? You stop at a breakpoint, look through the variable values, maybe set a few other breakpoints… And find out that the connection has been reset because the other end had a fixed 50-millisecond timeout, and it took you slightly longer to study 10 different variables. I have hit this pothole far too many times, so when designing the key features for VisualGDB 5.5, I decided to do something about it.

Interestingly, most modern ARM devices provide a mechanism for reading their memory in a non-intrusive way, observing variable values, RTOS state, and even executed code branches in real time and without any interference with whatever the CPU is doing, although most modern debugging environments tend to not make use of it. So I’ve set myself a challenge to overcome this limitation and make debugging of real-time connected systems easier, and in this post I will show you what we have managed to accomplish.

Continue reading Live Non-Intrusive Debugging of Real-Time ARM Targets