One of the major design goals of VisualGDB is to help our users easily navigate large C/C++ code bases. This is possible due to our heavily optimized Clang-based IntelliSense engine, that can replace the regular VC++ IntelliSense for VisualGDB projects. It uses multiple threads to fully analyze the entire codebase and build a detailed map of your classes, functions, methods, and relations between them. This has enabled features like CodeJumps and integration with Visual Studio’s Code Map.
VisualGDB 5.6 introduces another feature that will save you time dealing with large projects: Code Explorer. And in this post I will give you a tour of its main highlights.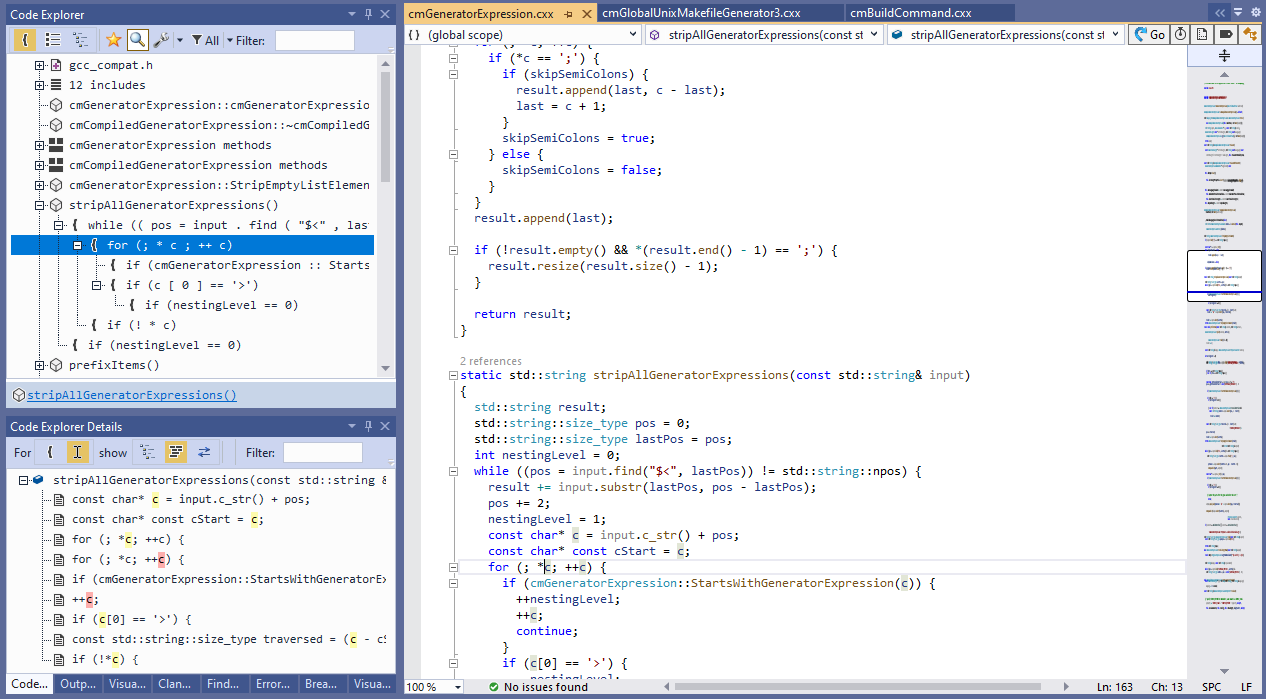
Code Explorer supports two views: Outline and Globals. The Outline view (1) shows a condensed structure of the current source file. It helps immediately understand the context of the source code you are looking at (2). If you enable the details view (3), it can follow the cursor in the code editor, and immediately look up local references to variables, contents of classes, functions called by other functions, etc. Because this information is taken by parsing the current source file only, it shown nearly instantly and does not require analyzing the entire project.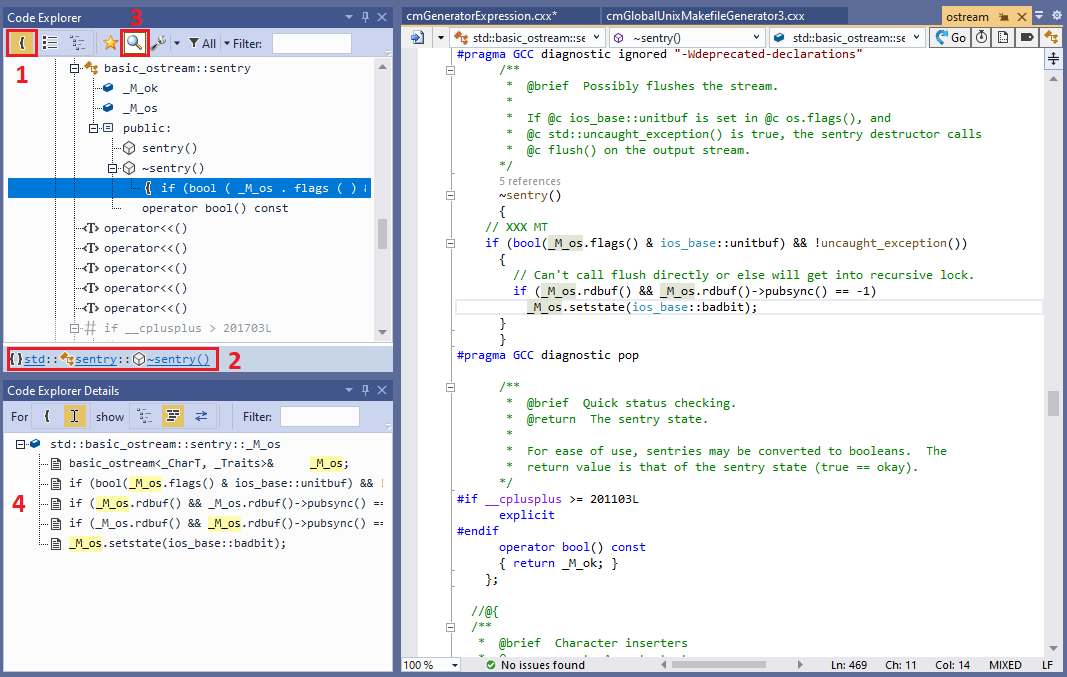 The outline view is highly customizable. You can pick the detail level (e.g. whether to show individual “{}” blocks), restrict the view to specific entity types, easily collapse/expand subtrees, mark individual entities as favorite, etc.:
 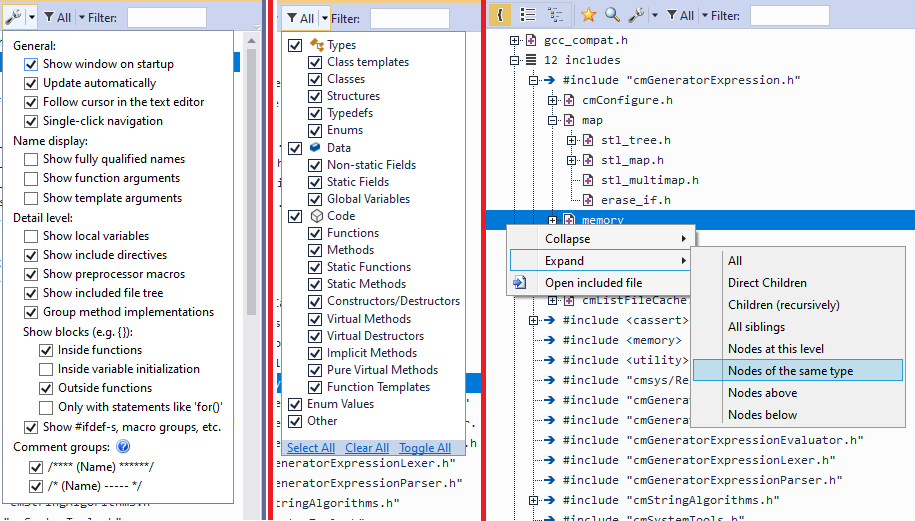 The Globals view shows the detailed information from the entire solution. It shows a hierarchical view of all classes, methods, types, etc., allowing you to instantly filter them, manage the “favorite” flag, and quickly explore the relations between them:
 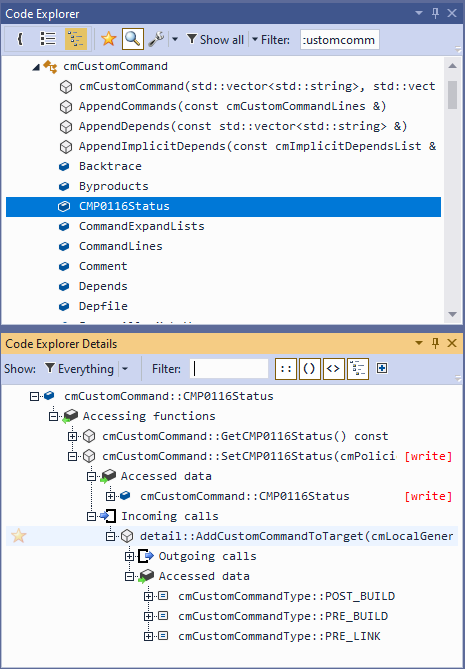 The details view can be configured to show a single relation (e.g. derived types) or multiple ones at once. The information is taken from the same global cache that is used by CodeJumps and “Find all references” command, so it works almost instantly even for large projects. You can use the “Expand one level” button to quickly search the cache for all nodes that haven’t been expanded yet, so getting a bird’s eye view of all related classes or methods is usually just a few mouse clicks away:
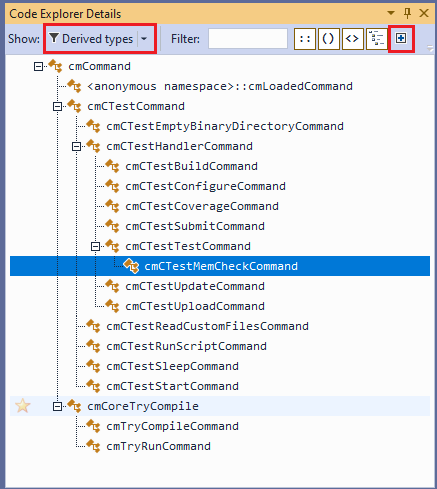
Give It a Try
VisualGDB 5.6 Beta 5 includes several other improvements and fixes. We have improved the usability of Live Watch, added support for multi-core devices to STM32CubeMX projects, improved gdb breakpoint setting performance, and much more. You can download the new preview build on the download page. If you have any feedback, don’t hesitate to reach us out via our support form or the VisualGDB forum.