We are excited to announce the release of VisualGDB 5.5 Preview 5. This version focuses on advanced non-intrusive debugging, introducing several features that let you inspect the state of your program without ever having to interrupt it. It also introduces support for ESP-IDF 4.1 and includes several other fixes and optimizations.
New Live Watch
VisualGDB supported Live Variables for a while. Unlike the regular Watch window that only works when the debugger is stopped, Live Variables allow monitoring the state of selected variables in the background, while the program is running. However, adding new Live Variables, or expanding pointers or structures was slow, as it involved stopping the debug session to query this information from gdb.
The new VisualGDB Preview solves this once and for all by taking full control over the debug symbol handling. Now instead of manually entering each variable in the Watch mode, you can switch to the Globals view and quickly browse through all the global variables: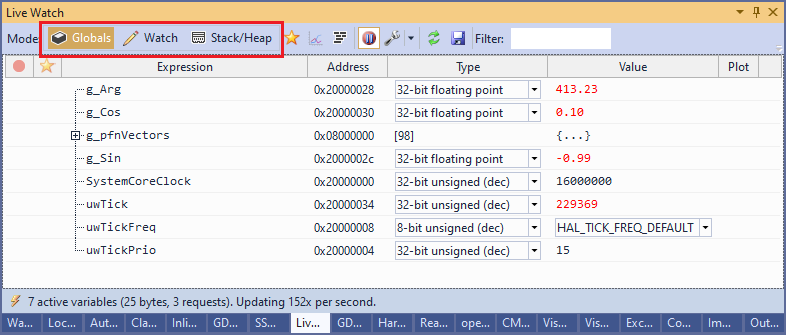
The Globals view supports fast filtering, “favorite” flag and works with structures and pointers: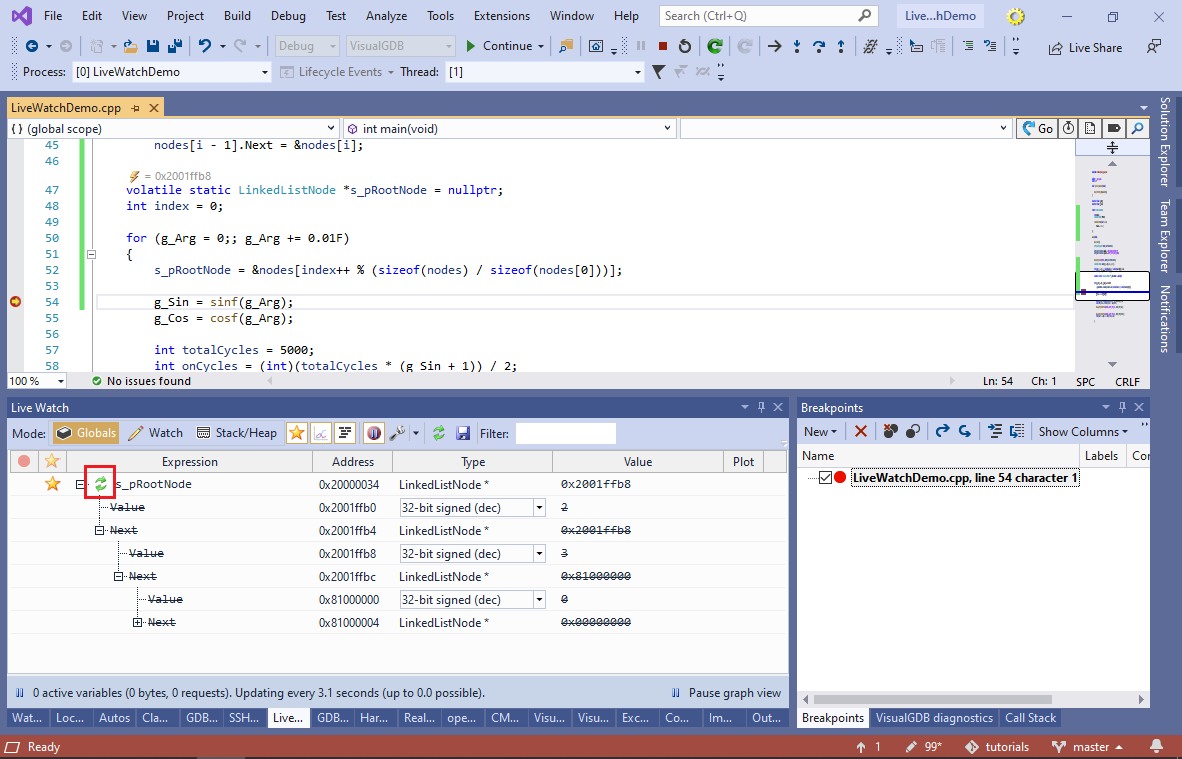
Because VisualGDB knows where exactly where each variable is declared, it can also show the values directly in the code: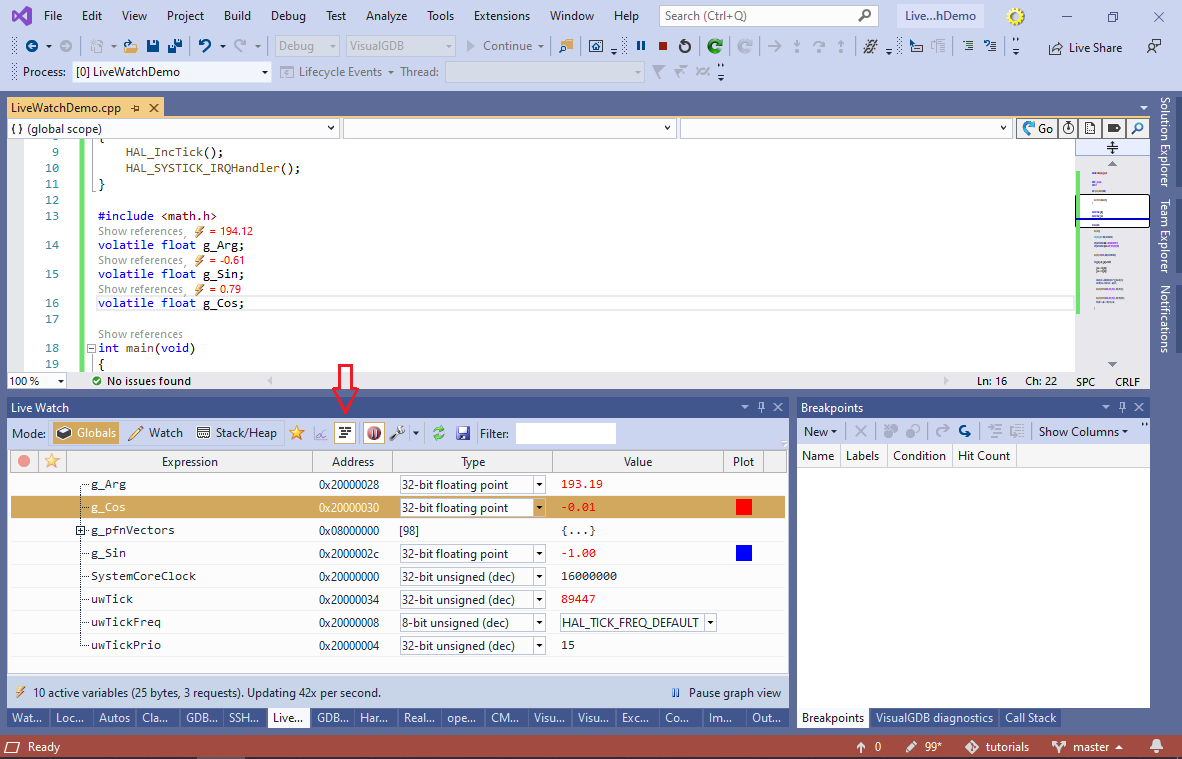
All of this works without stopping the GDB session, so you can get a very good idea of what your real-time application is doing, without having to interfere with its flow. Especially, when used together with Live Coverage.
RTOS Analysis
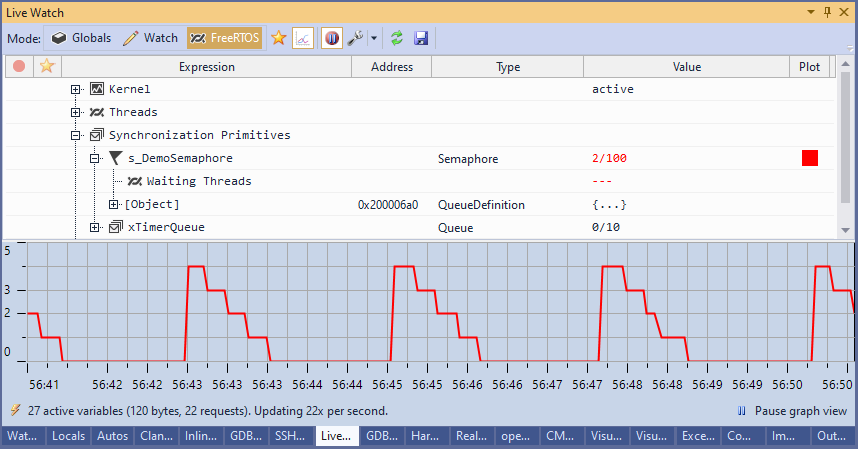
Live Watch can also make sense of the internal RTOS state without any instrumentation overhead. Simply switch to the “FreeRTOS” view and see detailed information about the kernel state, threads, mutexes, semaphores and queues: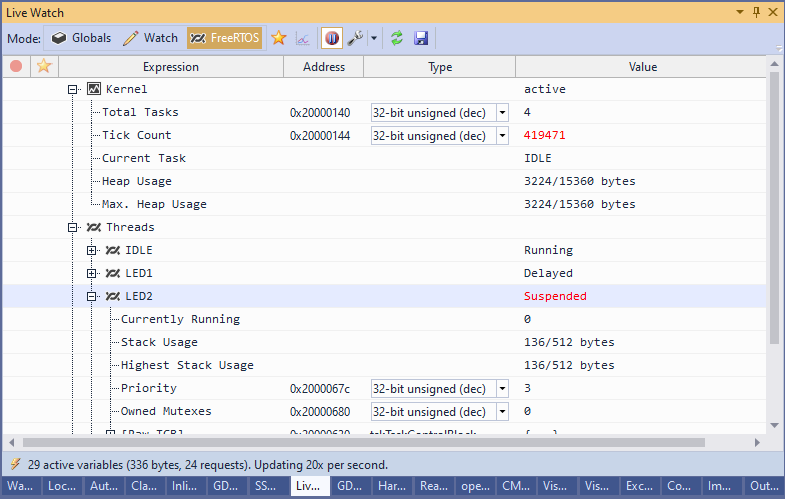 You can now see the owner of each global mutex, inspect (and plot) the value of semaphores, queues, or track the thread run time in a purely non-intrusive way with zero instrumentation overhead:
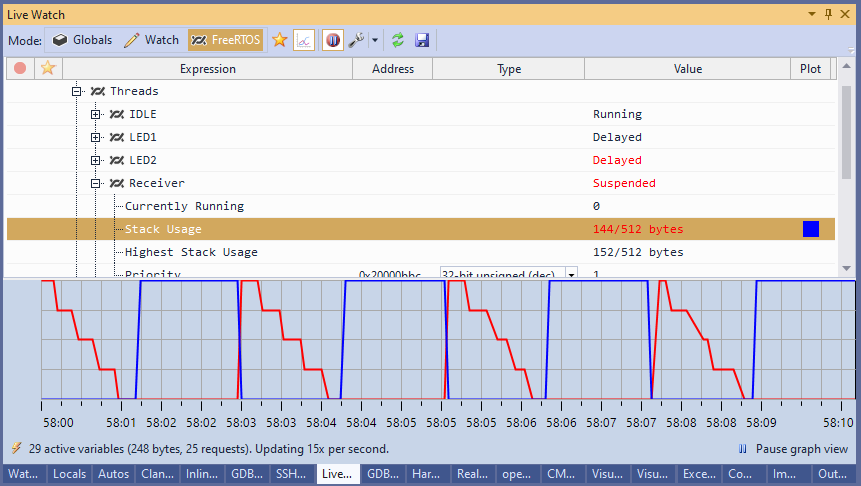
Live Stack and Heap Monitoring
The new Live Watch includes a live stack usage monitor, that scans the memory allocated for the stack, and detects when the initial pattern gets overwritten.
If you are using the FreeRTOS heap, or newlib-nano heap, VisualGDB can now parse the heap structure and show a detailed report on available and used memory, or let you inspect individual blocks: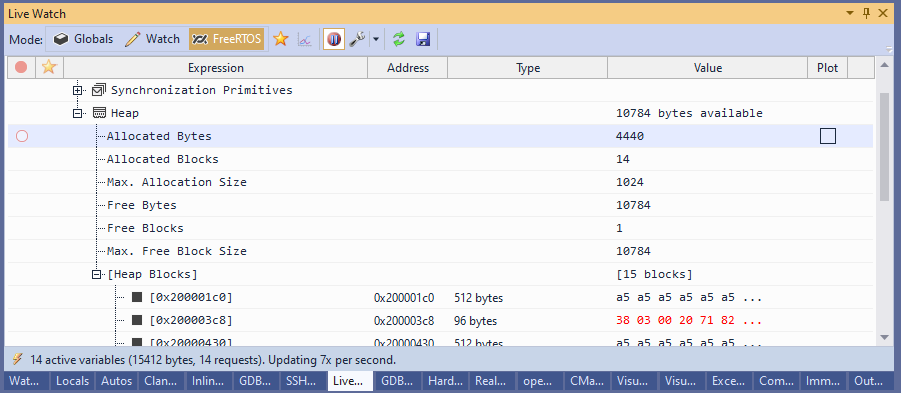
Live Watch Plugins
Live Watch goes beyond just showing you the global variables, or threads. The new extensibility interfaces let you develop your own Live Watch plugins, visualizing the state of the most critical parts of your system, without ever having to interrupt it. VisualGDB will take care of memory caching, I/O optimization, plotting and watching for specified conditions, so you can fully focus on understanding your program’s state.
To make plugin writing easier, we have released the code for analyzing the FreeRTOS state and the general stack/heap analyzer as two open-source plugins, so you can fork them as a starting point in your experiments.
Better Path Mapping Troubleshooting
If VisualGDB doesn’t manage to set a breakpoint in your Linux project, or the path reported by GDB appears incorrect, it will now automatically suggest rectifying it: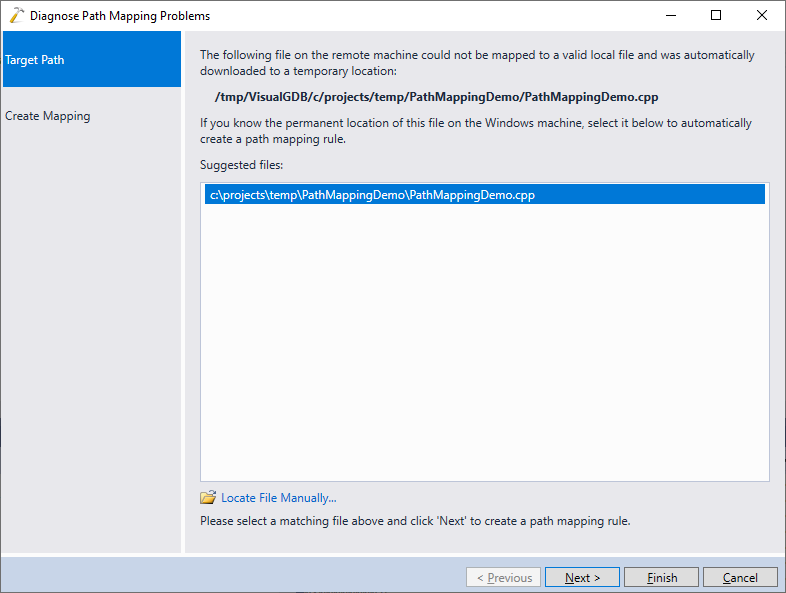 This fixes issues caused by target symlinks, moved projects, inconsistent symbols and many other problems. Once the correct path is found, VisualGDB will automatically suggest adding a generic path mapping rule:
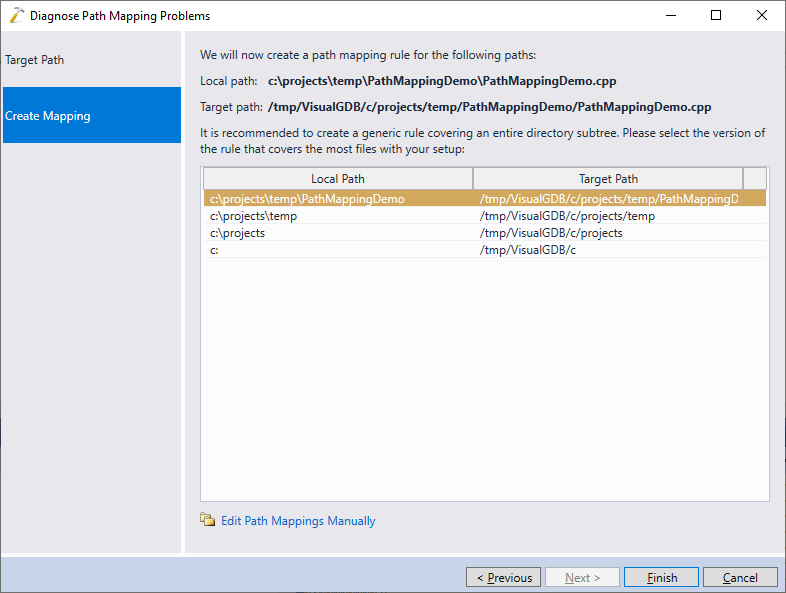
ESP-IDF 4.1 Support
VisualGDB is now compatible with the new ESP32 toolchain layout, that decouples the Python environment from the compiler and the rest of the tools. This enables support for the latest ESP-IDF 4.1, adds seamless integration for the ULP tools, and allows speeding up your builds by using CCache. Don’t forget to grab the latest ESP32 toolchain here, or update via the VisualGDB Package Manager.
Give It a Try
VisualGDB 5.5 Preview 5 includes several other improvements and fixes. We have optimized the IntelliSense popup performance, reduced memory usage, on large projects, improved Memory Explorer accuracy for IAR/Keil and solved a few other issues. You can download the new preview build on the download page. If you have any feedback, don’t hesitate to reach us out via our support form or the VisualGDB forum.