Have you ever tried debugging a beefy IoT-enabled chip connected to the world via Wi-Fi, Bluetooth, Ethernet, or even a good old boring CAN bus? You stop at a breakpoint, look through the variable values, maybe set a few other breakpoints… And find out that the connection has been reset because the other end had a fixed 50-millisecond timeout, and it took you slightly longer to study 10 different variables. I have hit this pothole far too many times, so when designing the key features for VisualGDB 5.5, I decided to do something about it.
Interestingly, most modern ARM devices provide a mechanism for reading their memory in a non-intrusive way, observing variable values, RTOS state, and even executed code branches in real time and without any interference with whatever the CPU is doing, although most modern debugging environments tend to not make use of it. So I’ve set myself a challenge to overcome this limitation and make debugging of real-time connected systems easier, and in this post I will show you what we have managed to accomplish. 
Examining Variables Non-Intrusively
If you try examining the value of a global variable in gdb (let’s say “print xTickCount“) without stopping the target, it will hit you with an error message even if you are using the async mode:
Cannot execute this command while the target is running. Use the "interrupt" command to stop the target and then try again. |
Interestingly, this is just a technical error. You can bypass it by finding out the address of xTickCount from your ELF file (run “arm-none-eabi-objdump -t <ELF file>“):
LiveWatchDemo: file format elf32-littlearm SYMBOL TABLE: <...> 20000144 l O .bss 00000004 xTickCount |
Now you let gdb run in peace and telnet directly to OpenOCD, you can use it to read the memory at address 0x20000144 without stopping the target, observing how it updates in real-time:
> targets TargetName Type Endian TapName State -- ------------------ ---------- ------ ------------------ ------------ 0* stm32f4x.cpu hla_target little stm32f4x.cpu running > mdw 0x20000144 0x20000144: 0005569a > mdw 0x20000144 0x20000144: 0005597a |
Although this technique works, manually entering variable addresses into OpenOCD would be a productivity nightmare. So I designed a neat tool window that does it automatically once you enter the variable name:  It works pretty fast, especially after patching OpenOCD to read multiple memory regions in one command.
Viewing Complex Structures
If you look deeper into the ELF files, there’s a whole bunch of other information you can find about variables and types. You just need to look at the DWARF symbols (“arm-none-eabi-objdump -g <ELF file>“) instead of the symbol table. DWARF symbols track where each variable is defined, what exact type it has, what are the structure fields, and so on. In practice, you can quickly walk over all global variables and build a searchable list of their names, addresses and possible fields.
Because all the information is stored in the ELF files, it doesn’t require any interaction with the target. Let’s say we have a simple example like this:
struct ControllerState { int Mode; int Status; }; struct Controller { struct ControllerState *State; int Reserved0, Reserved1; }; struct Controller g_Controller1, g_Controller2; |
Asking gdb to do find all members of all variables containing ‘status’ would take forever, because it would try to separately expand all children of g_Controller1, and then do the same for g_Controller2. However, having the DWARF symbols makes this much easier. All we need to do is to check that struct ControllerState definitely has a field called “Status“, struct Controller may point to an object that definitely contains such field, and g_Controller1 and g_Controller2 are of types that may contain the field among their children. This takes a single loop over all DWARF types to flag them either fully matching, or containing a possible match, all without having to talk to the target.
In practice, it means instant searches within the program state that isn’t constrained by your JTAG/SWD performance: 
Bringing FreeRTOS Into Play
Having a searchable list of all global variables is nice, but could it be practical to extract a higher-level view from it? Like a list of FreeRTOS threads, queues and semaphores? Turns out, yes. Because the actual updating of FreeRTOS state takes less than 1% of the time, sampling the global variables as the program is running can get a very accurate insight into its state.
The bottleneck here would be the latency – walking a list of FreeRTOS threads could involve tens of memory reads, slowing down the updates to a crawl. Thankfully, we found an elegant solution to it by splitting the Live Watch API into 2 layers:
- Pinned variable API that allows finding out addresses of thread lists, mutexes or queues (and individual fields). It doesn’t depend on reading the actual target memory and works very fast.
- Live variable API registers certain memory addresses a “live watches” so VisualGDB can poll them periodically. Thanks to the mbatch command we added to OpenOCD, it also works very fast.
We made an open-source plugin for analyzing and visualizing the FreeRTOS state based on this 2-layer API and it turns out it works pretty fast. Once the addresses of all “next” pointers of kernel structures are registered as live variables, VisualGDB fetches them all in a single memory read operation, making the latency negligible: The plugin reliably shows threads, mutexes/semaphores, and even individual heap blocks. Also because FreeRTOS prudently fills the stack area of all new threads with a fixed value, we can watch that in real time to see how much stack space was used by each thread.
Monitoring Code Paths
OK, we found a way to watch the global variables non-stop, but could we do the same thing to the code? Apparently yes, although it involves some GCC black magic. The good news is that GCC has the -coverage flag that allows instrumenting the compiled code to generate coverage reports (summary of all branches taken by the code). The bad news is that trying to that on an embedded device will is a sure way to get a heart attack due to the memory overhead: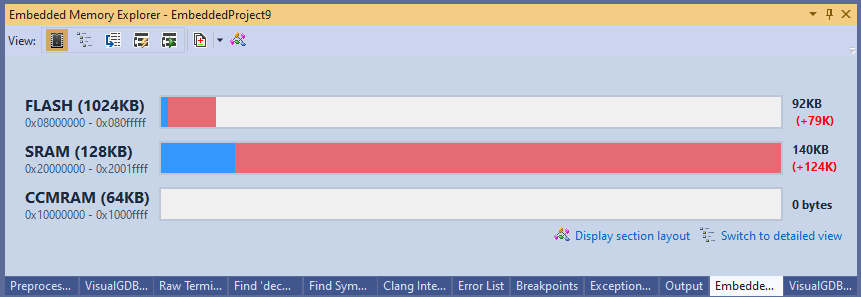 It only looks bad at a first glance though. It turns out, enabling GCC code coverage does 3 very specific things:
- It creates a counter variable for each branch in each instrumented function.
- It generates special metadata that can is needed to translate the branch counters into .gcda files, that can be later translated into gcov reports.
- It pulls in the __gcov_init() and __gcov_exit() functions that are will generate the data files for gcov.
This works splendidly on Linux, and miserably runs out of RAM on an average embedded microcontroller, except…
Except steps 2 and 3 don’t actually need to run on the microcontroller itself. Due to GCC portability, the branch counters and the metadata work the same way on ARM and x86. What is means in practice, is that we can surgically cut out the metadata and the translation logic out of the ELF file, then sample the branch counters using the background memory access API and transplant the captured data into a Win32 process that will produce a surprisingly accurate gcov report.
This makes the memory overhead much more palatable: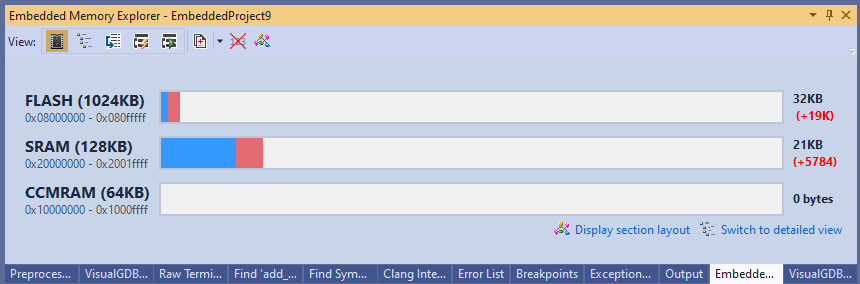 It also enables observing the executed code branches in real time. All we need to do is let gcov generate a new report based on the transplanted branch counters, and see which line counters have recently changed:
Since all gcov-related logic runs inside the Win32 process, the target doesn’t need to be stopped to see what’s going on. The only catch is that you need to compile GCovServer on Win32 using exactly the same same GCC version as you used for the target, so that it could interpret the branch counters correctly.
Conclusion
The non-intrusive debugging techniques give a nice insight into what’s happening inside the device without stopping it from responding in a real-time environment. They could be used to check if the threads or interrupt handlers are running as expected, quickly find out the values of important variables, or parse and visualize the state of complex real-time frameworks like FreeRTOS. These techniques work with most ARM Cortex-M devices using the OpenOCD tool and Segger J-Link GDB stub, and are also supported by some RISC-V devices.