Today we are proud to announce the release of VisualGDB 5.6 Beta 3. This version introduces the ability to directly debug the PIO module of Raspberry Pi Pico, adds support for custom debug setups, increases the stability of the Xilinx Vitis integration, and contains numerous other improvements. In this post I will give you a overview of the main features introduced in this release.
 PIO Debugger
One of the coolest features of Raspberry Pi Pico is the programmable I/O module (PIO). It allows interfacing the chip with arbitrary external interfaces at blazing speeds. It can run cycle-accurate programs at the RP2040’s 133 MHz system clock, handling external clocking, frame signals, acknowledgement, or anything else, while conveniently getting the data to or from the on-chip DMA engine. PIO consists of 4 independent state machines, programmed using a special PIO assembly language.
VisualGDB 5.6 Beta 3 allows you to look under the hood of the PIO module, showing the contents of its internal registers, inputs and outputs. The PIO debugger works hand-in-hand with the regular CPU debugger. So you can get your main program to the point where it loaded the PIO program, configured the DMA and is ready to start the state machines, and then let the PIO debugger take over: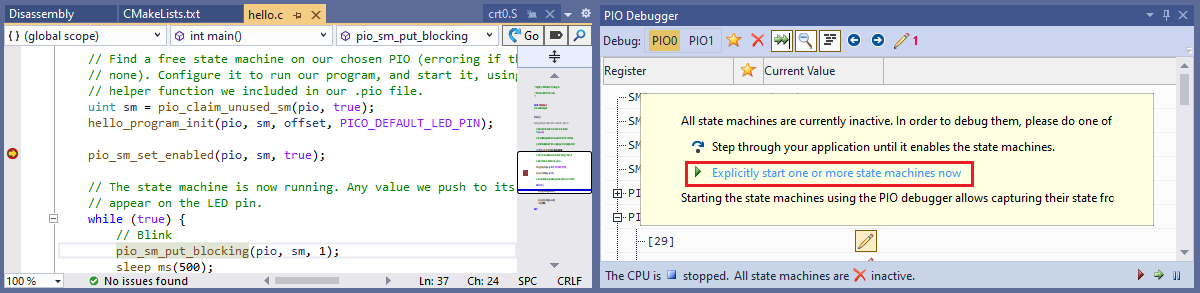 Once you step the PIO in the PIO debugger, it will capture the value of any internal register of every active state machine (including the instruction pointer) and will display it, letting you step back and forth through it:
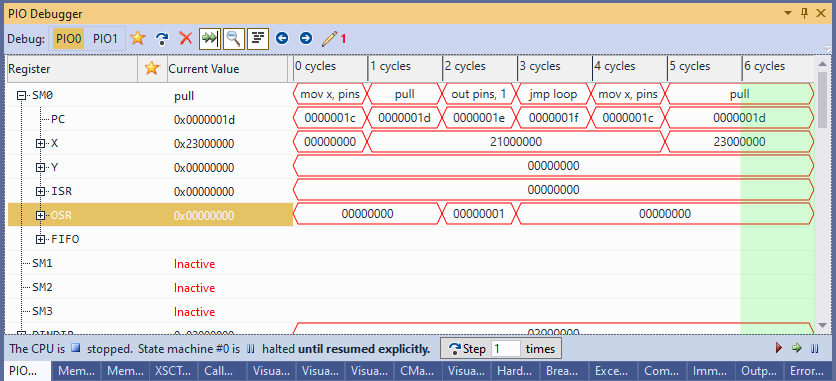 The CPU will remain stopped while the PIO debugger is running (it will actually a special mini-program controlling the PIO), but the DMA will continue working as usual. If your program manually pushes or pulls the data from the PIO, you can configure VisualGDB to keep the PIO halted even when the CPU is resumed, and simply alternate the CPU and PIO steps.
Naturally, capturing every step of the PIO will considerably slow it down, so it may not keep up with the fast external interface anymore. And that’s where the signal overriding comes into play:
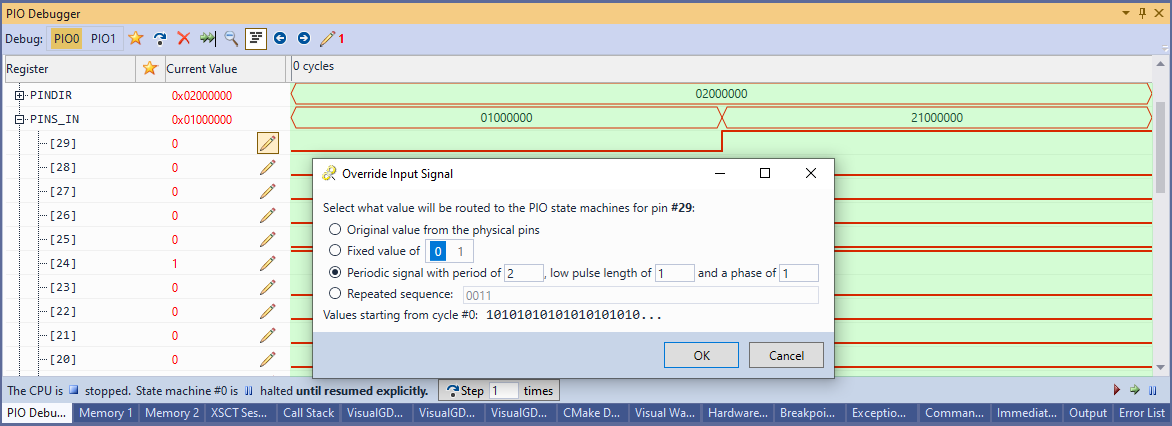 You can programmatically override the inputs fed into the PIO while it’s stepped in the debugger, so you can test out various scenarios without actually having to play them out in hardware.
Debugger Setups
Another major feature introduced in VisualGDB 5.6 Beta 3 is Debugger Setups. They are custom commands that appear next to the regular Debug command in Solution Explorer and the main menu: 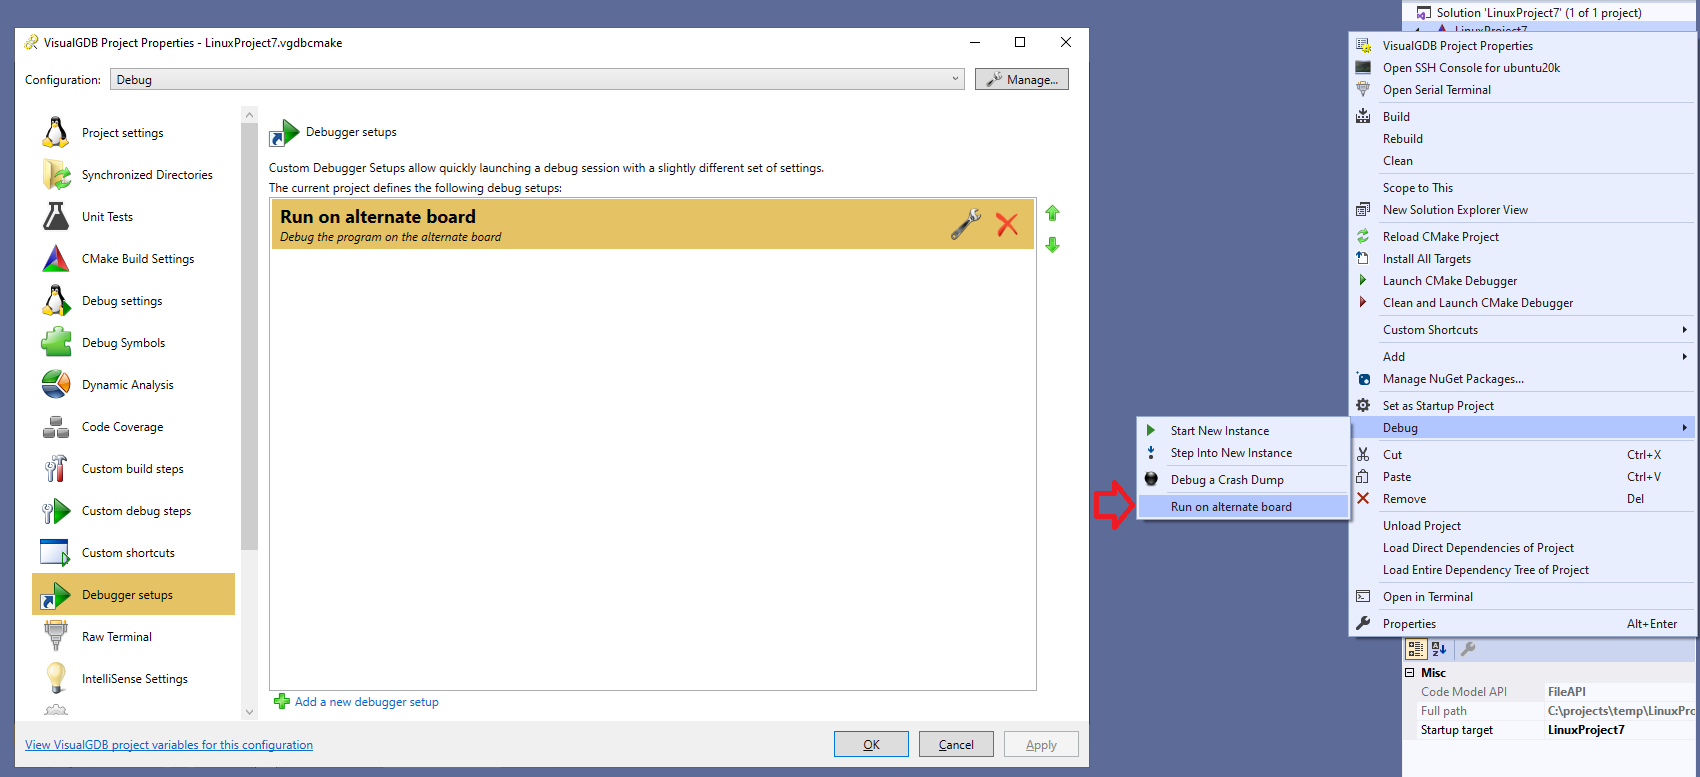 Each debugger setup inherits the regular project settings, but allows arbitrarily overriding the debugger settings. E.g. you can have a separate debugger setup with dynamic analysis enabled, another one for quickly testing out the program on an alternate board, and yet another one configuring gdb to run some extra setup commands:
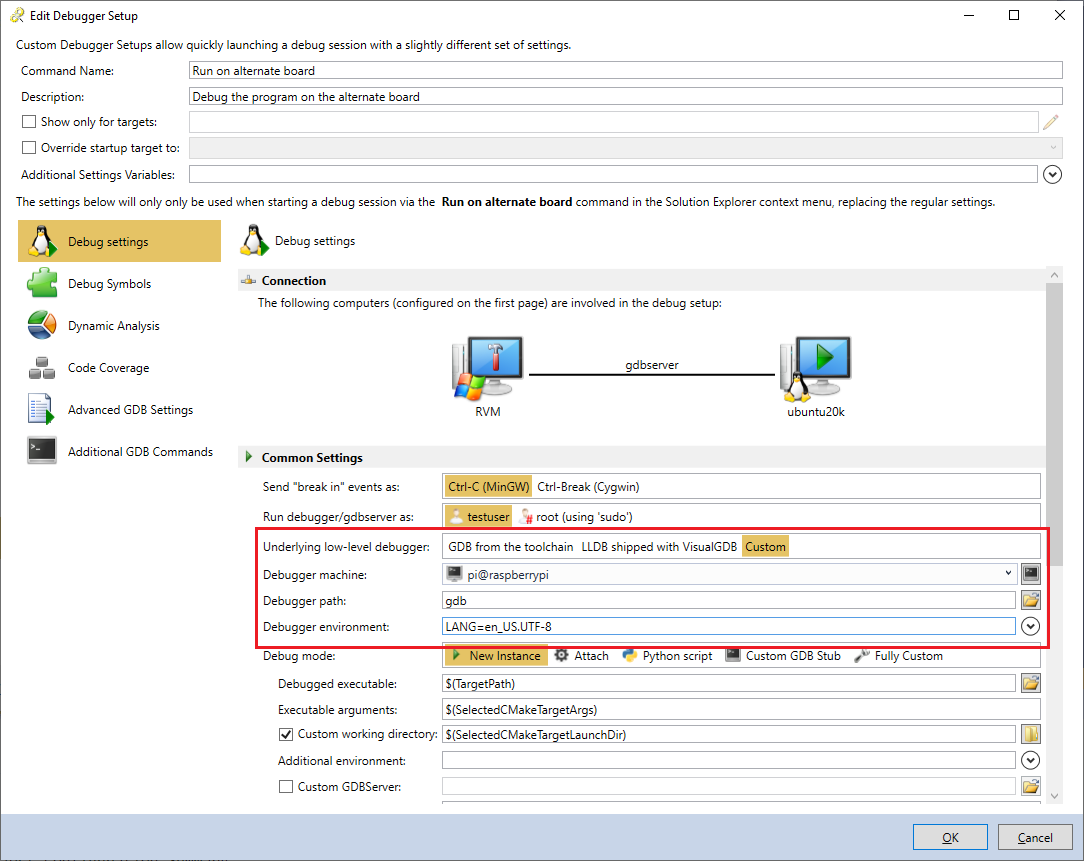 For advanced CMake projects with multiple targets, the custom debugger setups can override the selected target, so you won’t need to find it in Solution Explorer each time, or they can be configured to only appear in the context menu for specific targets.
Workaround for Keil Symbol issues
If you have been using VisualGDB to debug the code produced by the Keil compiler, you might have experienced cases where changing the code just a bit would prevent the GDB debugger from stepping into some functions, or showing them in Call Stack. We were aware of the issue for quite a while, but were never able to fully reproduce it until recently, thanks to the feedback from one of our customers. We narrowed it down to a bug in the debug range computation in the Keil compiler and updated VisualGDB to automatically detect it and rebuild the corrupt range table, so GDB will have no problem debugging it.
Give It a Try
VisualGDB 5.6 Beta 3 includes several other improvements and fixes. We have added support for ESP32C3 and ESP-IDF 4.3, improved the usability of various settings and much more. You can download the new preview build on the download page. If you have any feedback, don’t hesitate to reach us out via our support form or the VisualGDB forum.