Today we have released VisualGDB 6.0 Beta 2, featuring numerous improvements to the Live Tracing system and other parts. In this post I will give you an overview of them.
VisualGDB 6.0 – Live Tracing for Embedded Targets
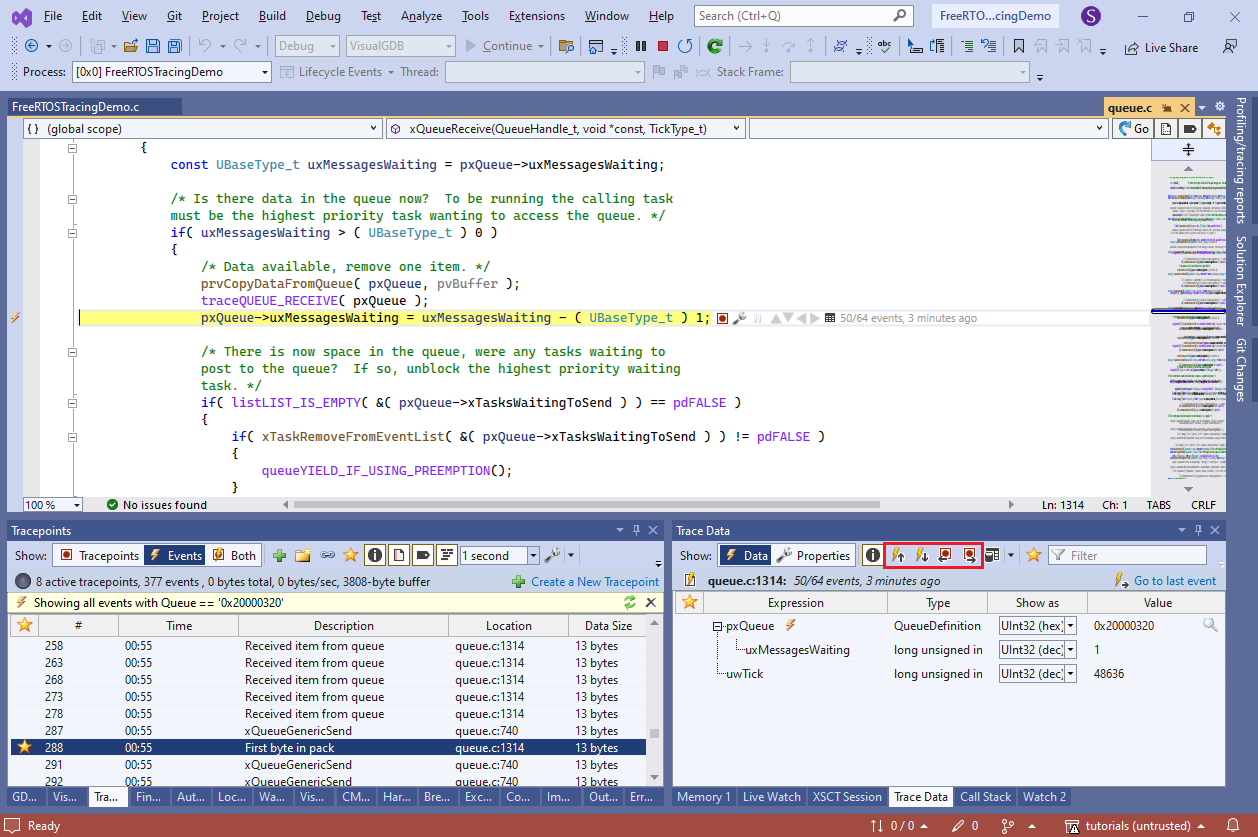
One of the toughest things about debugging embedded systems is that setting a breakpoint isn’t always an option. Sometimes, you don’t know where exactly the problem is until everything crashes. Sometimes, you cannot pause your device for a couple of seconds because it’s continuously talking to other parts of the system. Even if you can, good luck finding that inconsistency among 100 USB packets handled by your device within the past second.
VisualGDB 6.0 fixes this once and for all with the new software-based Live Tracing – a mechanism for setting tracepoints and recording what exactly the application is doing without having to stop it: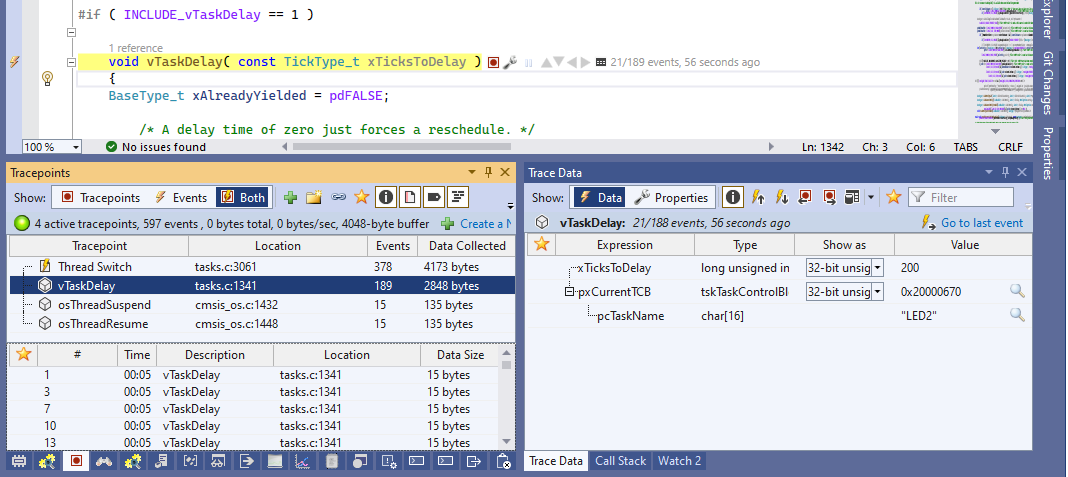 Continue reading VisualGDB 6.0 – Live Tracing for Embedded Targets
Announcing VisualKernel 4.1
Today we are pleased to announce another update to VisualKernel. It brings numerous improvements to the recently introduced tracing engine (see this page for a full change log), but most importantly, it brings the ability to trace Linux kernel (or individual modules) without a regular network connection.
Introducing Advanced Linux Kernel Tracing
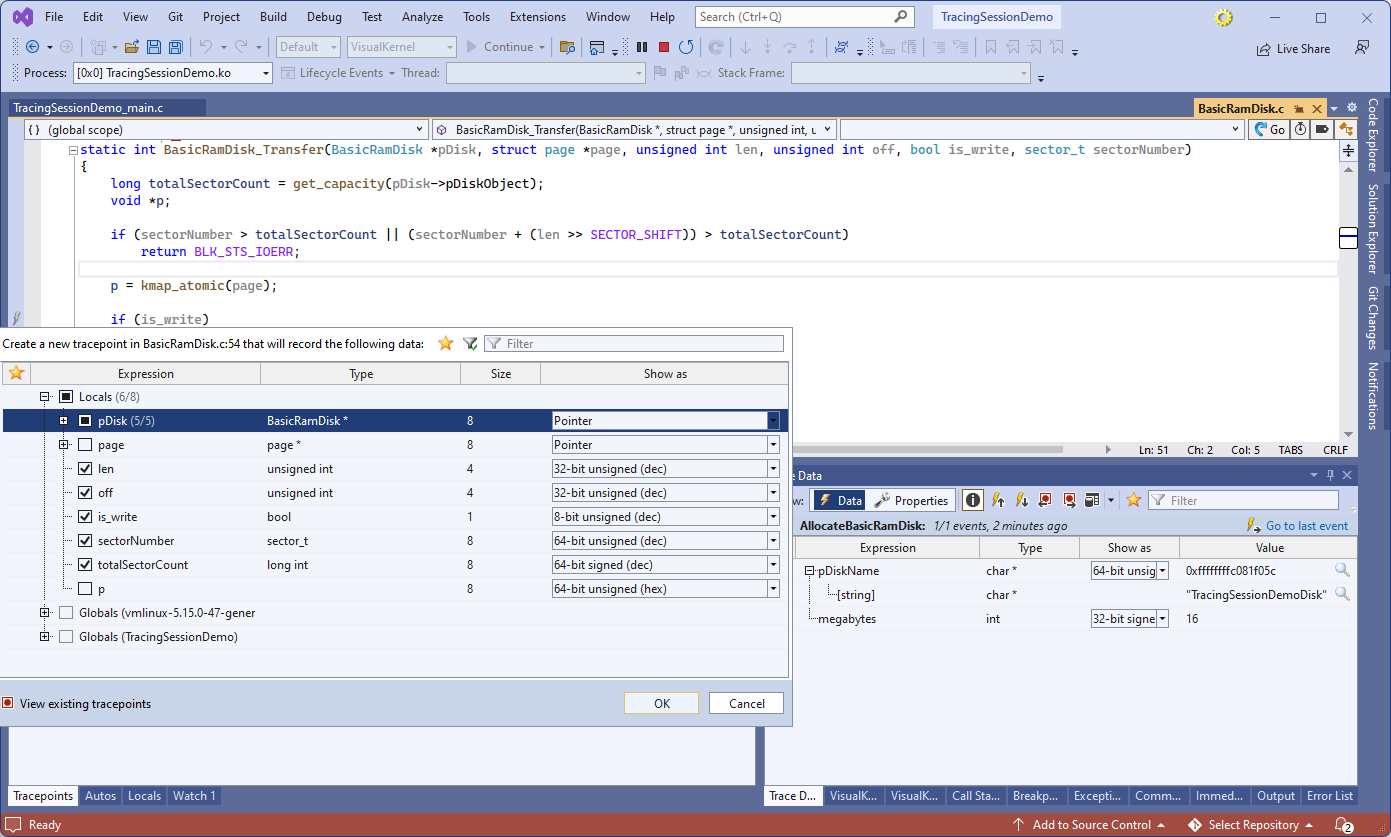
Today we are proudly releasing VisualKernel 4.0 that introduces a huge usability improvement to kernel debugging workflows.
The Achilles’ heel of kernel debugging is trying to make sense of a complex live system running many operations simultaneously. Breakpoints and stepping provide some insights, but having the entire system stopped in the debugger often has side effects and breaks unexpected things.
VisualKernel 4.0 fixes this with Live Tracing – a new mechanism that allows quickly capturing, recording and reviewing arbitrary data at any point in time that could be interesting: 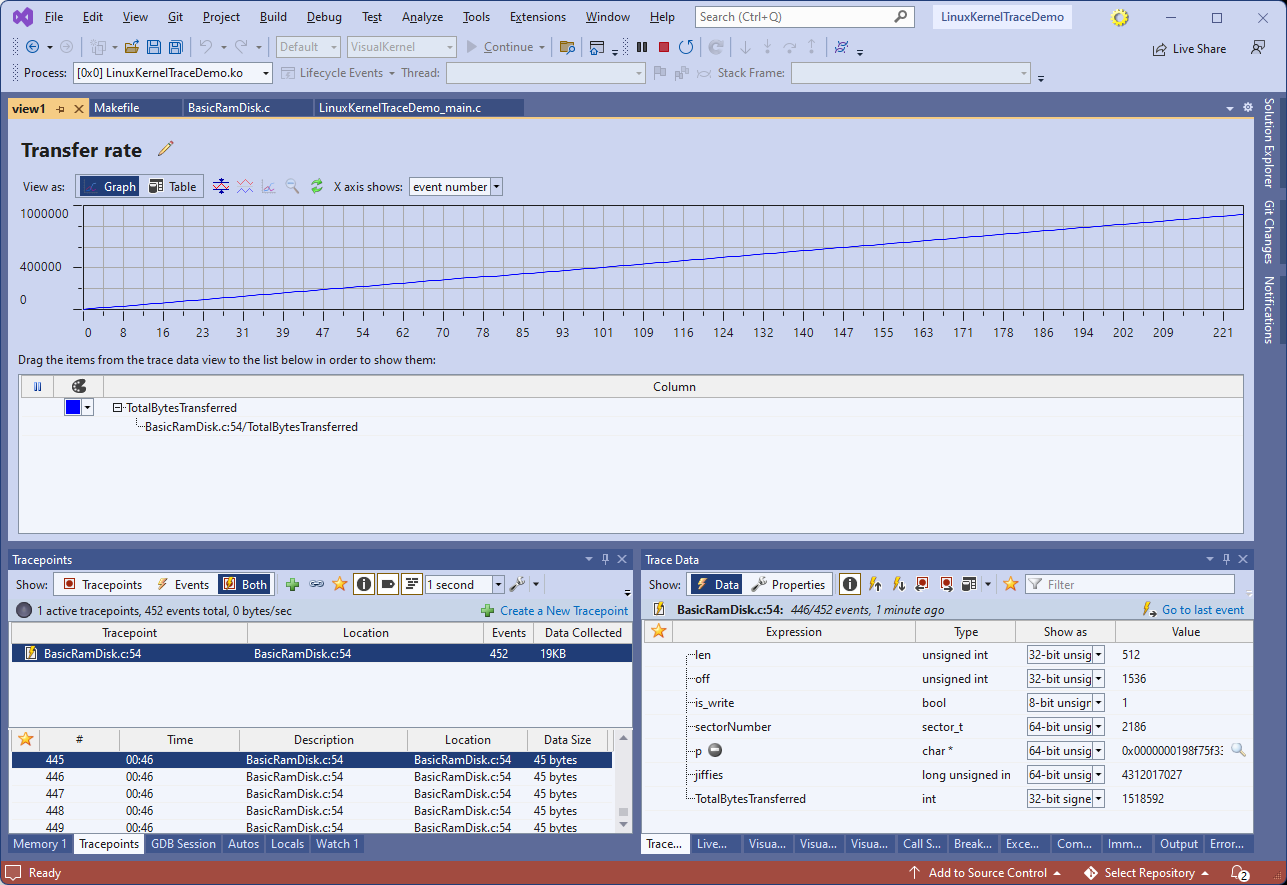 Continue reading Introducing Advanced Linux Kernel Tracing
Announcing VisualKernel 4.0
Today we are excited to announce the release of VisualKernel 4.0 Beta 1 – the most intuitive way to develop kernel-mode code for Linux. The new beta is packed with usability features, supports the latest versions of popular Linux distributions and comes with pre-built VM images that let you delve into the Linux kernel code without the need for lengthy setup.
Better Code Explorer filters in VisualGDB 5.6R6
Today we are excited to announce VisualGDB 5.6R6. This is a maintenance release mostly focusing on improving compatibility with various tools, however it includes one major usability improvement worth noting separately.
Continue reading Better Code Explorer filters in VisualGDB 5.6R6
Announcing VisualGDB 5.6
Today we are excited to announce that VisualGDB 5.6 is out of beta testing and is available as a stable release. Compared to the latest Beta 5, it features numerous improvements to the new Code Explorer GUI, as well as RefactorScript – a powerful mechanism for generating boilerplate code.
In this post I will give you an overview of the main highlights of the new release.
Introducing Code Explorer
One of the major design goals of VisualGDB is to help our users easily navigate large C/C++ code bases. This is possible due to our heavily optimized Clang-based IntelliSense engine, that can replace the regular VC++ IntelliSense for VisualGDB projects. It uses multiple threads to fully analyze the entire codebase and build a detailed map of your classes, functions, methods, and relations between them. This has enabled features like CodeJumps and integration with Visual Studio’s Code Map.
VisualGDB 5.6 introduces another feature that will save you time dealing with large projects: Code Explorer. And in this post I will give you a tour of its main highlights.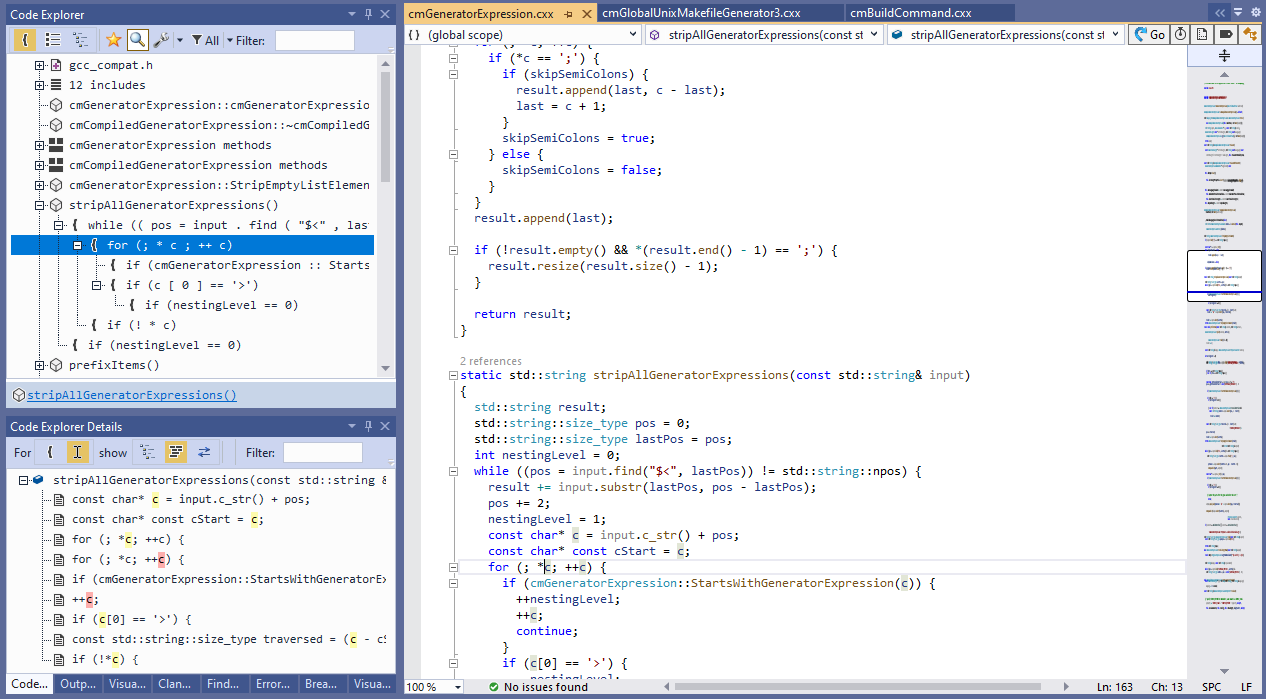 Continue reading Introducing Code Explorer
Announcing Visual Studio 2022 Support
When Microsoft first announced that the upcoming Visual Studio 2022 is moving to 64 bits, they caught us by surprise. Microsoft products are known for great backward compatibility, but that comes with a hefty cost of keeping alive numerous interfaces and technologies introduced several releases ago. Native components have to work side-by-side with managed components. COM interfaces have to work together with MEF interfaces. Legacy synchronous API should not break the new asynchronous one.
And to my great pleasure (and to Microsoft’s credit) they have done a tremendous job moving the unimaginably complex Visual Studio environment the x64 platform. Sure, it did require some changes on our side, but the overall process went much smoother than I could have anticipated.
What it means for our users, is that VisualGDB is now fully compatible with Visual Studio 2022 Preview. Simply download VisualGDB 5.6 Beta 4 and it will automatically detect your VS2022 installation and will integrate with it, so you can keep enjoying the best of both VisualGDB and Visual Studio without any distractions.
VisualGDB 5.6 Beta 3 is out
Today we are proud to announce the release of VisualGDB 5.6 Beta 3. This version introduces the ability to directly debug the PIO module of Raspberry Pi Pico, adds support for custom debug setups, increases the stability of the Xilinx Vitis integration, and contains numerous other improvements. In this post I will give you a overview of the main features introduced in this release.
