Forum Replies Created
-
AuthorPosts
-
support
KeymasterHi,
Unfortunately, it is hard to suggest anything specific based on the description you provided.
In order for us to provide any help with this, we need to be able to reproduce the problem on our side.
Please provide complete and detailed steps to reproduce the issue as described below:- The steps should begin with launching Visual Studio. They should include every step necessary to create the project from scratch and reproduce the issue, as many issues are triggered by specific combination of project/target settings.
- The steps should include the expected/observed behavior, so that we could follow them on our side and compare the outcome.
KeymasterHi,
Thanks for checking the debug output. Indeed, the stripping logic was not working with the custom imported toolchains, that internally use the $(ToolchainDir) syntax. We have fixed it in the following build: VisualGDB-5.6.105.4579.msi
KeymasterHi,
The “Strip debug symbols during deployment” option simply runs the toolchain’s objcopy executable on the primary output of each project before deploying it:
...-objcopy.exe --strip-debug <ELF file> <ELF file>-stripped
The <ELF file>-stripped file is then deployed to the target and deleted locally.
You can double-check what is going on by checking View->Other Windows->VisualGDB Diagnostics Console. You can also try running your toolchain’s objcopy executable (on the build machine) on the deployed ELF file to see if it manages to strip the symbols.
KeymasterHi,
The only fully tested & supported way to do this would be to use the Embedded CMake project subsystem (see this tutorial). You might be able to get it working with MSBuild as shown below:
- Follow the CMake tutorial to get a reference test project that builds and runs without hardware.
- Create a regular Win32 MSBuild executable. Manually add the unit test framework to it via VisualGDB Project Properties. Adjust the project until it builds and runs as well, using #1 for reference.
- Follow the MSBuild Platform tutorial to merge the settings from #2 into your main project. For MSBuild projects, VisualGDB only cares about the currently selected platform/configuration, so if you manually copy all settings (including the references to .vgdbsettings files) between projects, it will copy the related behavior regardless of what is defined in other configurations/platforms.
That said, this setup was never tested, and may trigger weird bugs. Proceed at your own risk only if you are comfortable patching MSBuild files and troubleshooting possible errors caused by it.
KeymasterThanks for renewing your license.
Normally, GDB would automatically search for libraries with symbols in its sysroot directory on the Windows machine (use the “show sysroot” command to find it out). However, you can override this behavior by issuing the set solib-search-path command via the GDB Session window, or adding it to VisualGDB Project Properties -> Additional GDB Commands.
Note that the library on the Windows machine must match the library loaded on the target, otherwise gdb would use incorrect addresses for most symbols, resulting in unpredictable behavior.
KeymasterSorry, our system still shows the old license expiration date. If you have placed a renewal order, please contact our sales with the order details.
KeymasterIt looks like your technical support period has expired. We would be happy to help you, however we would kindly ask you to renew your technical support on the following page first: https://sysprogs.com/splm/mykey
KeymasterHi,
The Custom Build Steps page is available on VisualGDB Custom edition or higher. If you are using a lower edition, you can always upgrade your key here: https://sysprogs.com/splm/mykey
KeymasterHi,
This happens because the copy command is not a separate executable, but is rather a built-in command of cmd.exe. Hence, you can launch it as follows:
File name: cmd.exe
Arguments: /c copy /b <…>KeymasterHi,
It looks like a bug coming from the toolchain or gdb executable. You can double-check the gdb replies to VisualGDB’s commands in the GDB Session window or in the GDB log. If the error message is present there, the issue is coming from GDB and is not controlled by VisualGDB.
If you wish, we can build a debug version of gdb, find the root cause of the issue, and patch it for you, however as it is not an issue of VisualGDB itself, it would be subject to our consulting rate.
KeymasterHi,
Thanks for pointing this out. The VisualGDB’s COM port sample is actually derived from the corresponding STM32 SDK sample (CDC_Standalone) for each device family.
We have rechecked the original SDKs and it looks like ST has updated the class/subclass values for some devices in the latest SDK, while left the old values for others.
We have updated our STM32 BSP generator to use the new values and confirmed that they work out-of-the-box on Windows 10 21H1. This fix will be included in the next release of the STM32 BSP, until then feel free to patch the files manually, or download the patched versions from our BSP generators repository (see this commit).
KeymasterPlease note that VisualGDB is a productivity tool for software developers. It can make developers more productive by providing convenient GUI for common time-consuming tasks, and integrating various external tools into Visual Studio, so that they are always a few mouse clicks away.
We are able to offer VisualGDB at affordable price, because we focus on developing and supporting functionality that works the same way for multiple users, hence the development and testing effort is reused between multiple license holders.
We also receive a huge amount of inquiries asking to fix a specific broken project, help make the correct design choice, explain how a specific C++ feature works, or assist porting a library to a different platform. These inquiries require considerable effort to research and communicate the best solution. They do not scale between multiple users. I.e. helping one user solve this type of problem will not automatically help other users. It also does not help the same user avoid the same type of problem in the future. Hence, we are not able to address them within our regular support. If we included this type of help in our support, we would simply not have sufficient resources to provide it at the current license prices, or to allocate any resources to VisualGDB development.
We are happy to offer project-specific help via our consulting service per Zoom, TeamViewer or any other screen sharing service of your choice at our consulting rate and are happy to solve any problems our users encounter. This includes a detailed follow-up email at the end of the session, that includes an overview of the used techniques and a summary of solved problems and future recommendations.
Alternatively, please consider browsing our documentation and tutorials. Our documentation lists most VisualGDB settings, and the tutorials show how to use VisualGDB for in many real-world scenarios. Our technical support is limited to issues in VisualGDB itself, that can be reproduced from scratch per our problem reporting guidelines (i.e. do not depend on external projects that can potentially contain errors).
KeymasterThanks, we have received the ELF file, however we could not reproduce the problem on our side – the addresses are different:
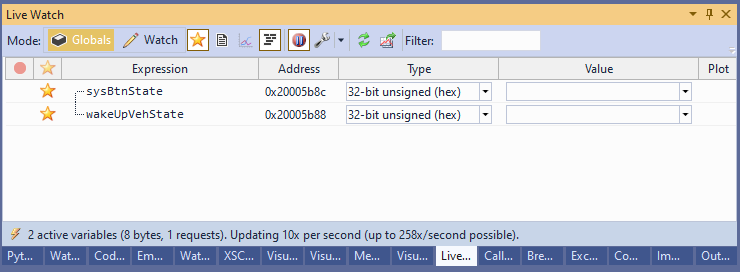
This could have been solved by a recent update to VisualGDB adding support to bitfields to Live Watch. Please feel free to update to VisualGDB 5.6r5 and let us know if the problem persists.
Attachments:
You must be logged in to view attached files.April 27, 2022 at 08:05 in reply to: Visual Studio: Update of VisualGDB failed, Reopen update dialog? #32567KeymasterHi,
You can manage VisualGDB toolchains and other packages via Tools->VisualGDB->Manage VisualGDB Packages.
KeymasterHi,
This looks like something coming from your system. All VisualKernel error messages are normally in English.
You can also try checking View->Other Windows->VisualKernel Diagnostics Console for more context on the error (e.g. stack trace).
-
AuthorPosts