Forum Replies Created
-
AuthorPosts
-
support
KeymasterHi,
Please make sure you use the latest VisualGDB 5.5 Preview 4. It will install CMake automatically. If it doesn’t happen, please share a screenshot of the About VisualGDB window and the first page of the VisualGDB Project Properties window for your project and we will advise on the steps to get this working.
KeymasterHi,
This looks like the target might be configured to drop the SSH connections after some inactivity time. Normally, VisualGDB would automatically reconnect to the target, however for some types of custom actions that would not work. If this is the case, setting the keep-alive packet period to about 1 minute in Tools->VisualGDB->Manage SSH Connections should fully work around the problem.
KeymasterHi,
This looks like a bug in OpenOCD. Please consider building it from sources as shown in this tutorial and stepping through the FLASH programming logic to pinpoint the problem.
Alternatively, please try using Segger J-Link instead. It comes with its own GDB stub that is more reliable than OpenOCD and is fully supported by Segger.
KeymasterHi,
If you have accidentally deleted the file built by the project, please try building the project again using the regular Visual Studio’s Build All/Rebuild All command.
KeymasterThanks, looks like you are using an MSBuild-based project.
Please refer to the following tutorial for an example on enabling the map files: https://visualgdb.com/tutorials/arm/linkerscripts/KeymasterHi,
According to our records, your support period has expired. In order to continue receiving support, please renew your key here: https://sysprogs.com/splm/mykey
KeymasterNo problem, we have investigated this and released another update. Please update your OpenOCD package via the VisualGDB Package Manager.
KeymasterHi,
No problem, looks like the upstream OpenOCD has renamed some JTAG-related commands and some of the scripts shipped with our OpenOCD build were not updated.
We have fixed the issue. Please try reinstalling the OpenOCD release via Tools->VisualGDB->Manage VisualGDB Packages.
KeymasterHi,
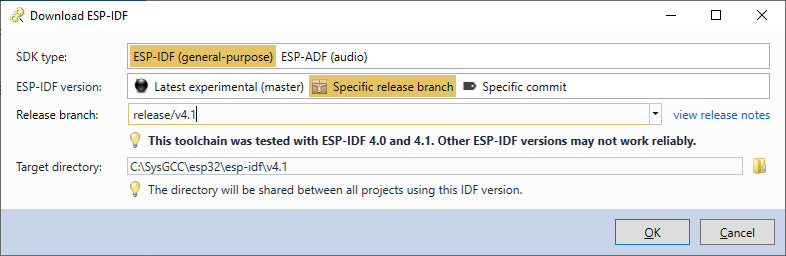
Please see the following page for a detailed explanation: https://visualgdb.com/support/idfcheckout/
Edit: VisualGDB 5.5 Preview 5 now fully supports ESP-IDF 4.1. Simply install it over any other VisualGDB version and get our latest ESP32 toolchain and you will be able to install ESP-IDF 4.1 into it:
-
This reply was modified 5 years, 10 months ago by
support. Reason: Mentioned new ESP-IDF 4.1 support
Attachments:
You must be logged in to view attached files.KeymasterHi,
This is already supported via VisualGDB Project Properties -> Debug Settings -> Full-Custom Mode.
Simply specify “–interpreter mi $(TargetPath)” in the gdb arguments and use the “target remote <host>:<port>” as the target selection command. This will connect gdb to a remote target.
You can also automate running the remote OpenOCD instance via the Custom Debug Steps page of VisualGDB Project Properties.
KeymasterSorry, it is not possible for us to provide the exact configuration steps for 3rd-party frameworks and tools, unless it is something extremely common (i.e. relevant to a huge amount of users) and worth supporting out-of-the-box and having a separate tutorial.
We can do the necessary research and publish a detailed tutorial as a part of our paid consulting program (please contact our sales for pricing). Alternatively, we can help you understand the VisualGDB side of the setup. E.g. if you manage to setup the project manually and find the correct compiler command lines and file layout, we can help you setup VisualGDB to replicate the manual setup results.
KeymasterThis sounds very similar to what is already supported with the VisualGDB project templates.
We actually have a huge collection of tutorials showing various VisualGDB features here: https://visualgdb.com/tutorials/You can find the one showing the project templates by searching for “templates” on the tutorial list page.
Please also feel free to look through other tutorials for ideas on further improving your productivity with VisualGDB.
KeymasterNo problem. Please share a screenshot of the entire VS window showing your solution and also a screenshot of the Help->About VisualGDB window and we will help you find the right setting.
KeymasterHi,
Please use the following page to search through all VisualGDB settings: https://visualgdb.com/settings/
You can find the up-to-date setting name by searching for “deploy”. Please also make sure you are using this build, as the Preview 4 might apply the setting incorrectly in some cases: VisualGDB-5.5.4.3549.msi
KeymasterUpdate: to make it less confusing while we are working on supporting the new JSON API, we have released VisualKernel 3.1R3 that will detect the cases when the VIX API is missing and will prompt to suspend and then resume the VM manually. It will still edit the configuration files automatically, minimizing the amount of extra steps.
-
This reply was modified 5 years, 10 months ago by
-
AuthorPosts