VisualGDB has been a Visual Studio extension since the very beginning. Before AI, before STM32CubeMX, before CMake became mainstream. But times are changing, and more and more development is moving to Linux and MacOS, where the “big” Visual Studio won’t work. So, today we are proud to release CodeVROOM 0.6 – a cross-platform port of VisualGDB, that does not depend on Visual Studio, and runs natively on Windows, Linux and Mac:
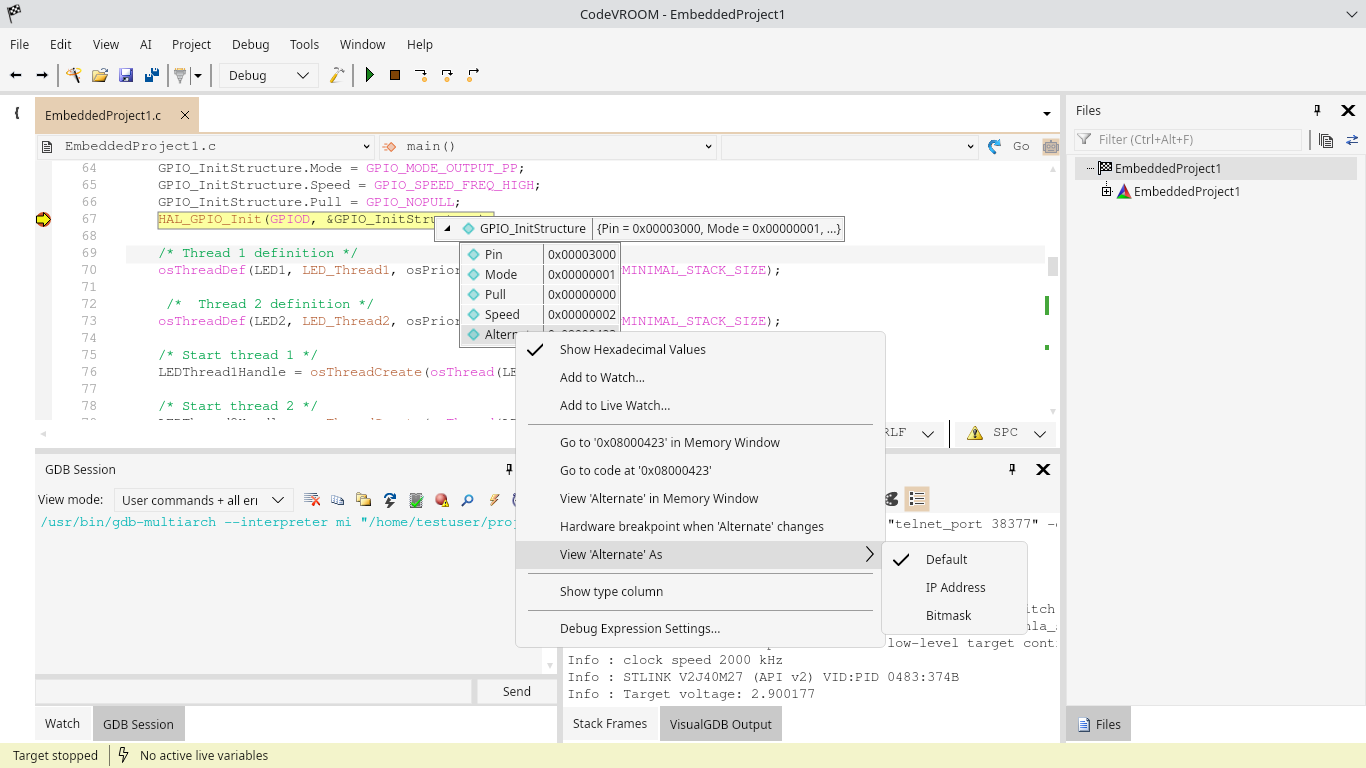 CodeVROOM 0.6 fully supports debugging via OpenOCD, J-Link and various custom modes. It has Live Watch built into the regular debugging GUI, so you can flag any Watch expression as live, or just hover your mouse over a global variable, and see its live value.
It supports Raspberry Pi Pico and ESP-IDF (including package installation) out-of-the-box, and is compatible with VisualGDB BSPs, such as STM32.
The debug engine has been designed from scratch, and avoids the main annoyances of the Visual Studio debugger. All time-consuming operations, like analyzing all threads, now happen in the background after showing where the target got stopped. This means, no matter how many tool windows are open, you can step through the code much faster than Visual Studio does. The next stop location will be shown immediately, and if you decide to do another step before all the threads finished loading, CodeVROOM will stop the load and do the step.
All major debug-related windows are there: Watch, Live Watch, Locals, Globals, Autos, RTOS Objects, Call Stack, Threads, Breakpoints, CPU Registers, Peripheral Registers, Memory, and, of course, the GDB Session window.
A lot more features are coming soon, but the current version can already handle many debugging tasks.
Here are the step-by-step tutorials for a FreeRTOS-based STM32 project for Windows, Linux and MacOS.
You can download CodeVROOM here. No installation needed, and it’s just a 30-50MB download, depending on the platform. VS Code extension for side-by-side debugging of existing projects is coming soon.