One of the most loved features of VisualGDB are the graphs integrated into Live Watch. Just one glimpse at the ADC-value-over-time graph can tell more about a potential problem, than dozens of debug stops. CodeVROOM now brings this functionality outside of Windows and outside of Visual Studio. Here’s a quick example: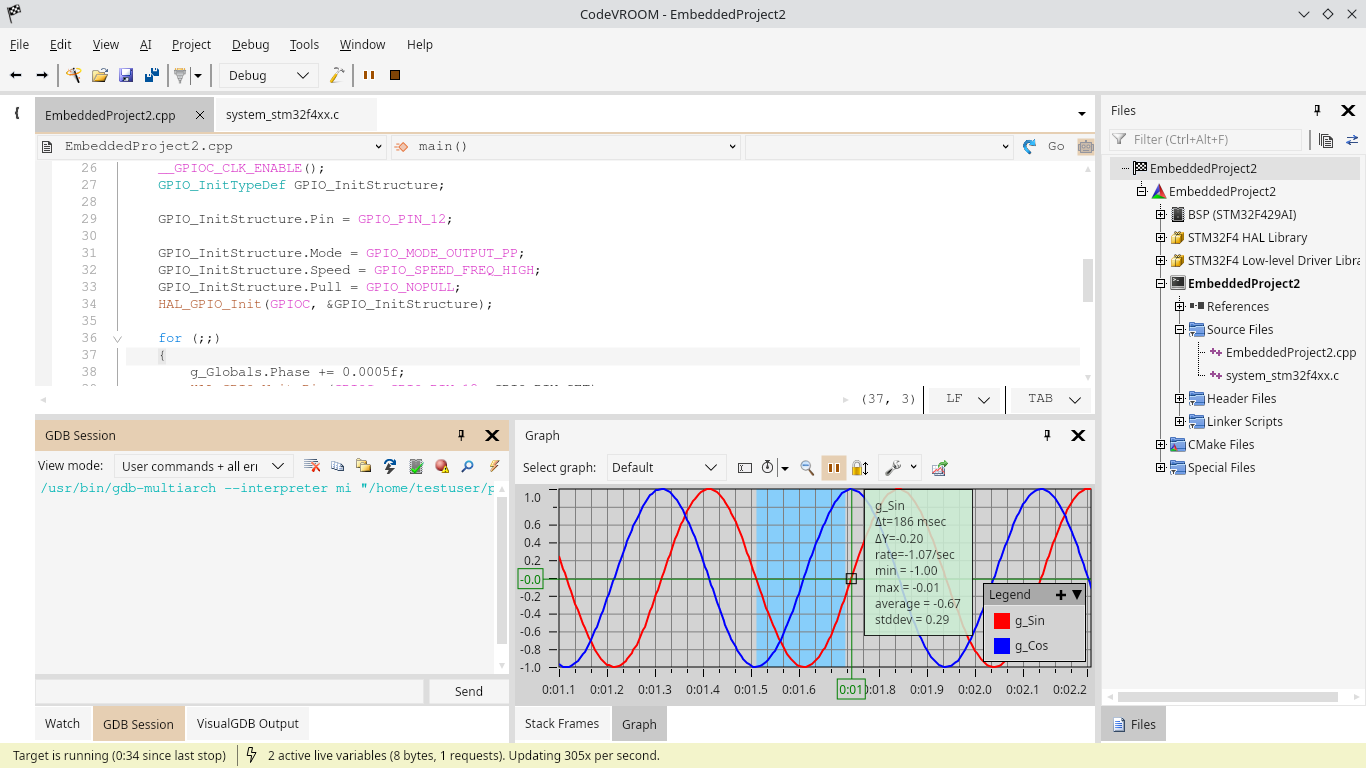 This is a live variable plot from an STM32 project, with CodeVROOM running natively on Linux.
The graph support in CodeVROOM is mostly a direct port of the VisualGDB’s graph engine, so zooming, data hints (including min/max/average analysis) and other functions work very similar. There are, however, a few important improvements compared to the Visual Studio-based VisualGDB:
- In VisualGDB for Visual Studio, there are two fixed graph views: one in the Live Watch window, and another one in Visual Watch. CodeVROOM removes this limitation – you can organize the plotted variables into named graphs, and view as many graphs at a time as you want.
- The graph view is also integrated into the variable popups. So, you can just hover over a variable, click the “plot” button, and quickly see what is going on:
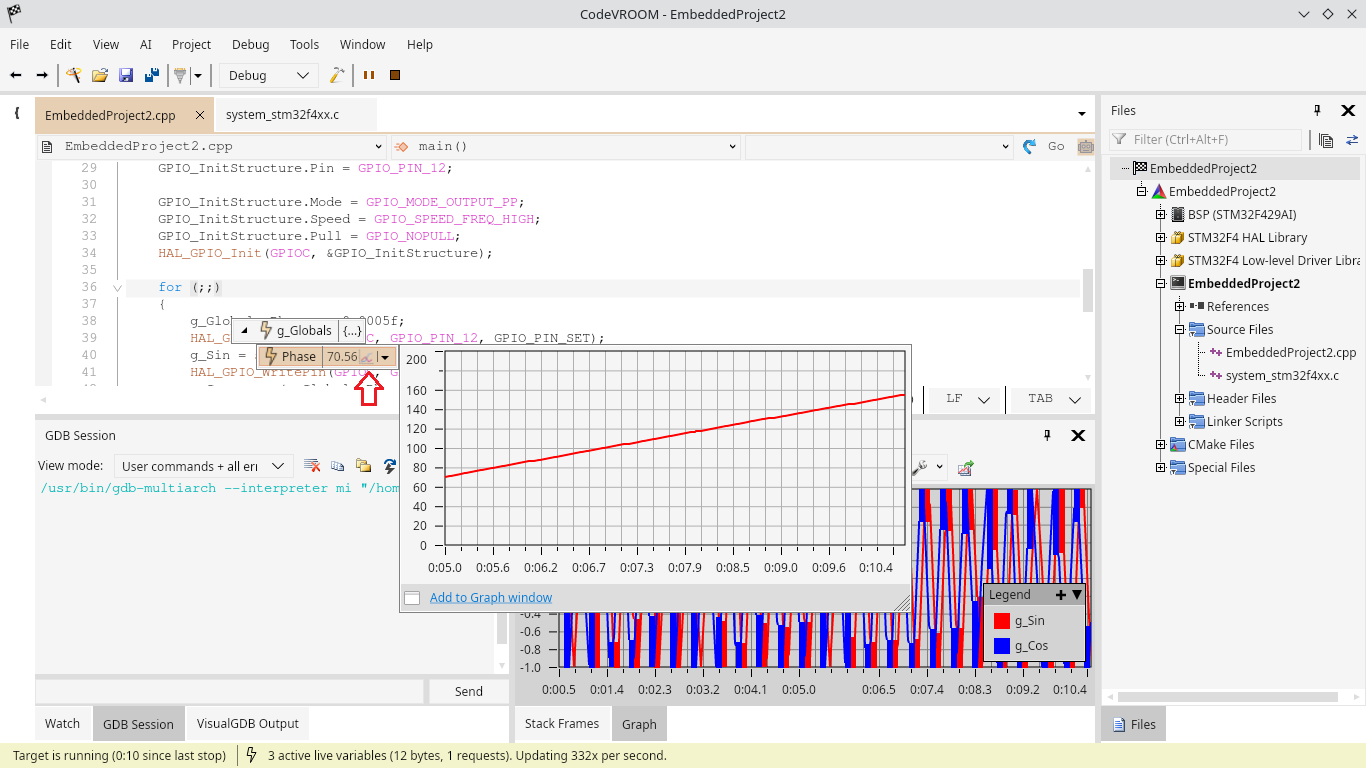 This also works for arrays in regular debug sessions. Just hover the mouse over it, click the graph icon, and immediately see the value.
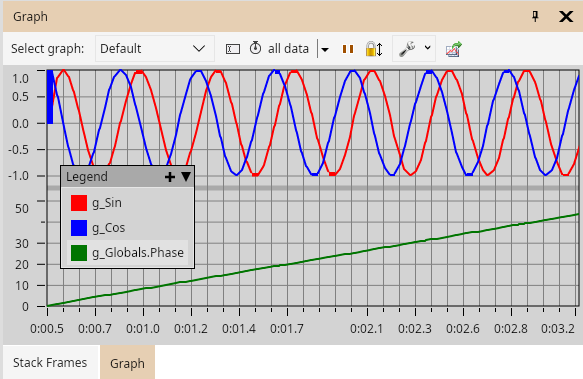
 - Variables on a single graph can be organized into bands with individual value scaling. So, if one variable is always much larger than others, you can still view them together:
You can download the latest CodeVROOM for Windows, Linux and Mac here. It does not need installation and can open existing VisualGDB projects based on Advanced CMake. Enjoy!