Today we are proud to announce the release of VisualGDB 5.3 Preview 8. This build mainly focuses on stability and usability improvements, such as better integration with Kinetis KSDK 2.x and support for importing Keil projects, however it also introduces a feature that greatly simplifies and reduces the overhead of analyzing precise timing of your embedded code – Chronometer.
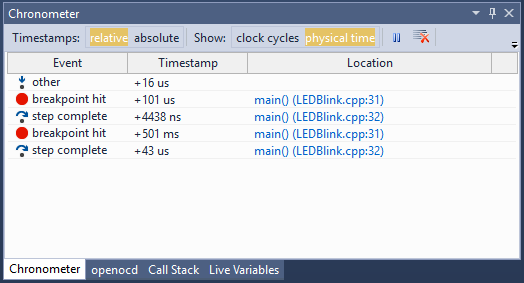
Chronometer is an extendable mechanism that makes VisualGDB aware of the clock cycles elapsed between different debugging events (like stopping at a breakpoint or stepping over a line of code). It doesn’t need to instrument any code and works by simply reading the debug registers of your microcontroller once the debugger has stopped the program, and attaching time labels to the debug events. As a result, you can quickly see how many clock cycles (and microseconds) a particular function call (or a block of code) took without the need to enable instrumentation, reference any frameworks, or change your program in any way.
Simply enable the Chronometer via the Embedded Debug Tweaking page of VisualGDB Project Properties and VisualGDB will show the chronometer window each time you debug your program: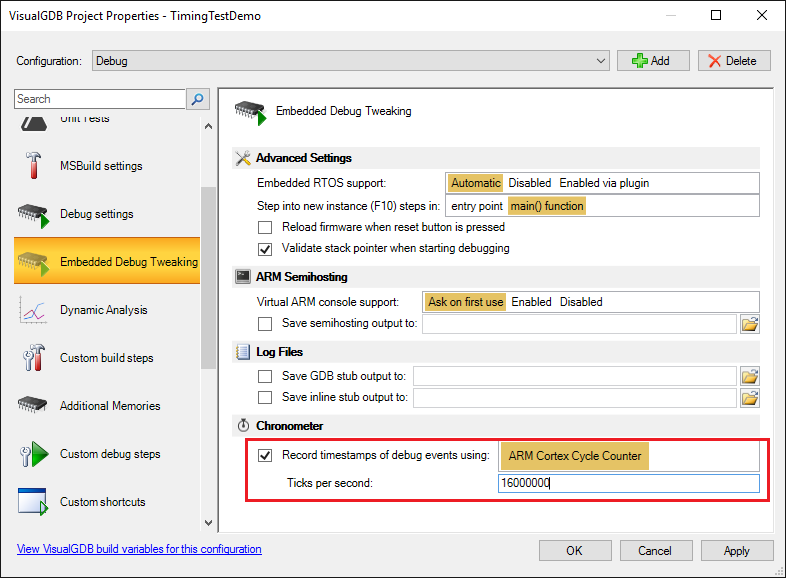
As of VisualGDB 5.3 Preview 8, the chronometer only works on ARM Cortex devices that support the debug instruction counter (a hardware mechanism for counting CPU cycles), however we designed this feature to be completely extendable, so you can configure it to use other sources of timing information (such as hardware timers) instead. Simply clone the default provider definition under C:\Program Files (x86)\Sysprogs\VisualGDB\TimestampProviders and tell VisualGDB where to read the current timestamp value and how to reset it to avoid overflows and it will pick it up: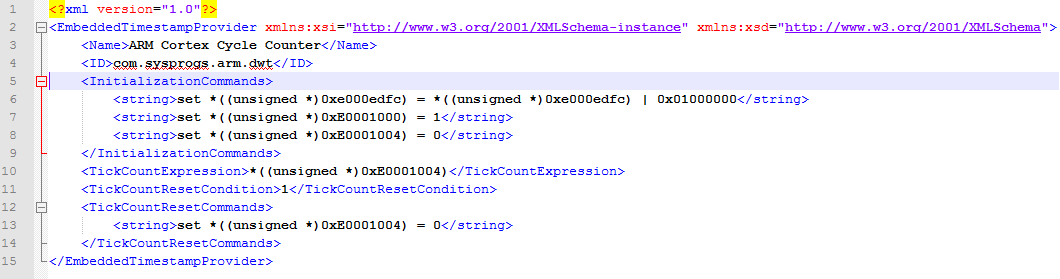
Integration tests
Chronometer is fully integrated with the recently introduced Embedded Integration Tests feature. As long as it is enabled for a project, you can attach meaningful labels to different points in time and then verify that the time passed since that label is within the expected bounds: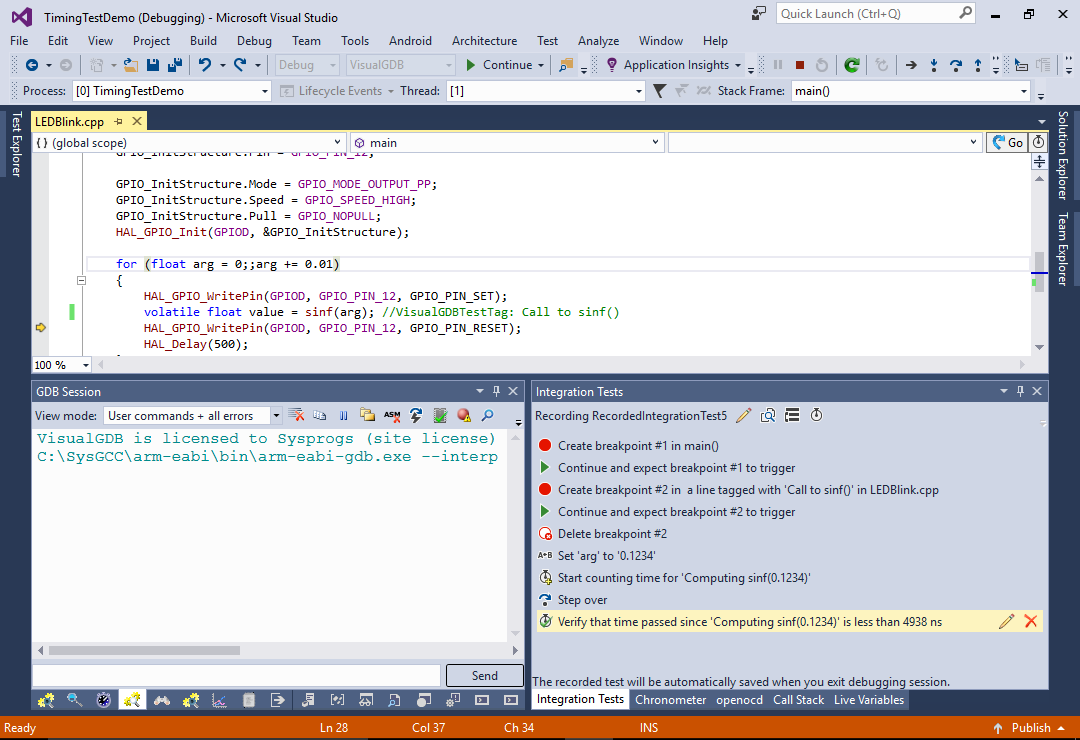
This could be useful if your program performs complex computations from interrupt handlers and you have strict constraints for the computation time so that it leaves enough CPU cycles for the other functionality. Record a simple integration test running the critical path and verifying the timings and you will get immediately notified once a change to any of your functions breaks the timing constraints.
Try it out
VisualGDB 5.3 Preview 8 is available for download at the VisualGDB download page. Give it a try and don’t hesitate to share your feedback via our forum or support page.