Today we are proud to announce the release of VisualGDB 5.3 Release Candidate 1. This version introduces profiling and code coverage support for Linux projects, Linux Dynamic Analysis, advanced code annotation and a few other improvements. In this post I will give you an overview of the new features: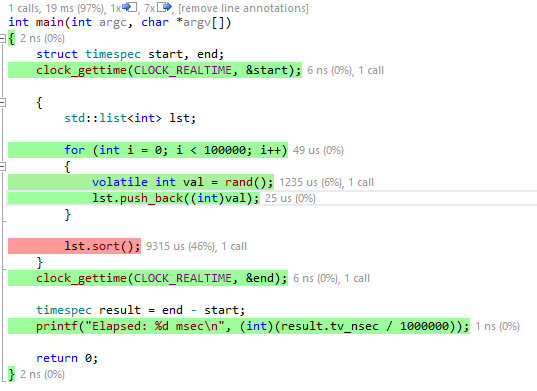
Linux Profiling
VisualGDB is now fully integrated with Valgrind – a powerful Linux profiling tool. You can now easily find the critical paths of your program by simply selecting Analyze->Analyze Performance with VisualGDB:
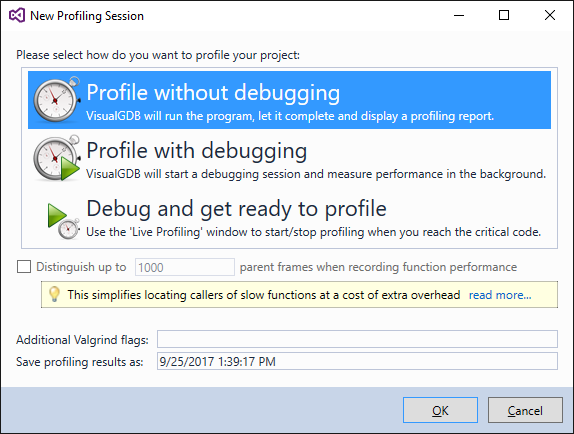
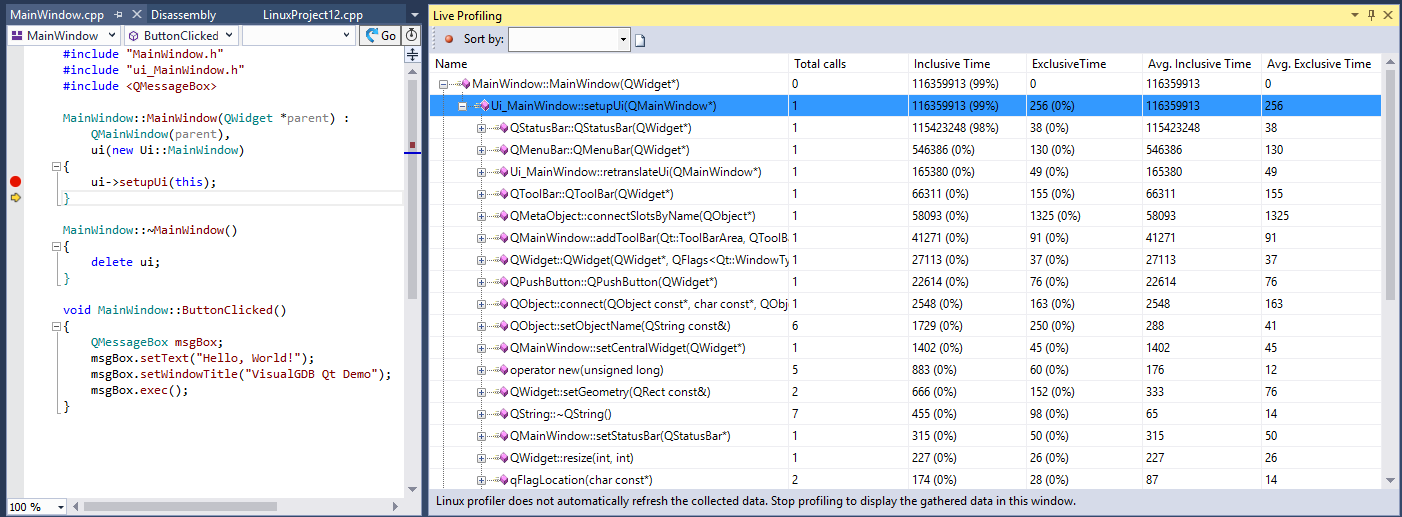
Profiling Linux projects looks very similar to profiling Embedded projects – VisualGDB will run the program under profiler and create detailed report files showing the amount of instructions executed within each function or line of code:
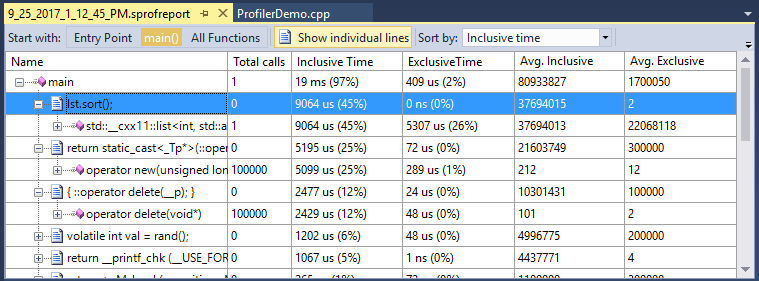
If you are using Visual Studio 2013, 2015 or 2017, VisualGDB will show the statistics like number of invocations, spent time and number of incoming/outgoing calls on top of each function in your code:
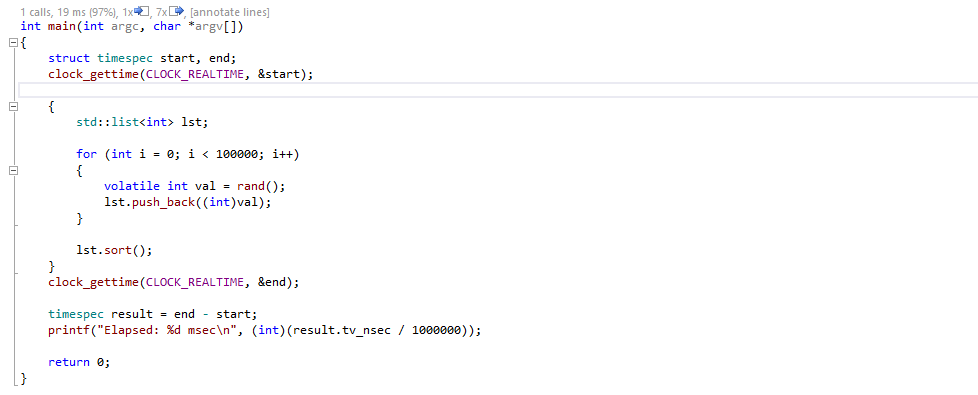
This lets you easily explore the real call tree (including the virtual methods) without waiting for the entire source code to be indexed:
You can also enable per-line annotations and VisualGDB will show you how much time each line took to run and which functions were called from that line: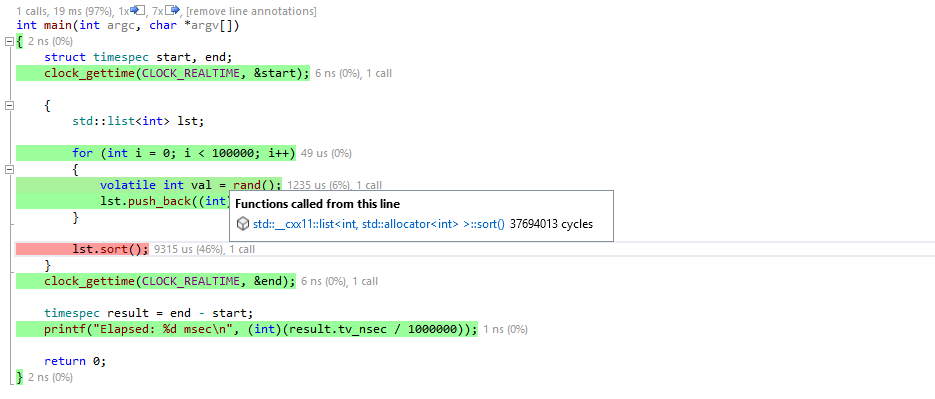
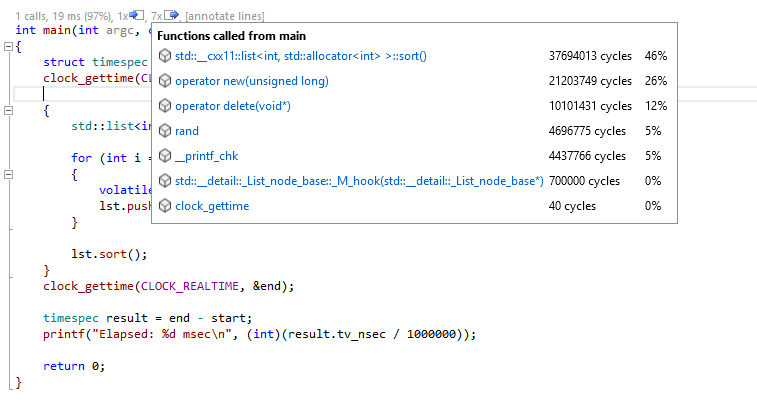
The profiler also tracks incoming calls, so you can see the list of all functions that called a certain function during the profiling session (even if this happens across multiple shared libraries):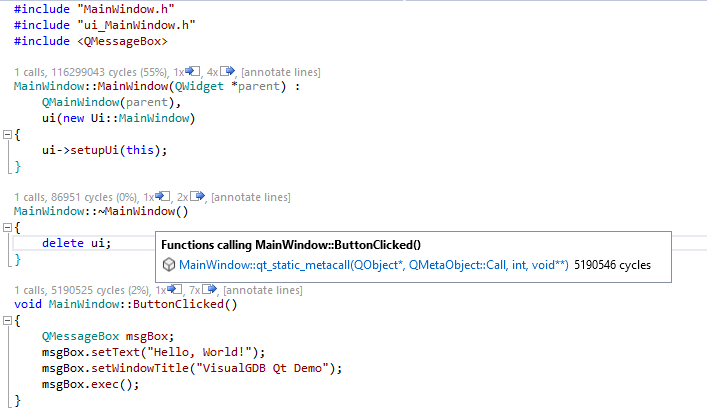
Then you can navigate the call tree to find the full call stack and understand the context better. VisualGDB can distinguish invocations of the same function from different contexts and will show the times and callers lists accordingly: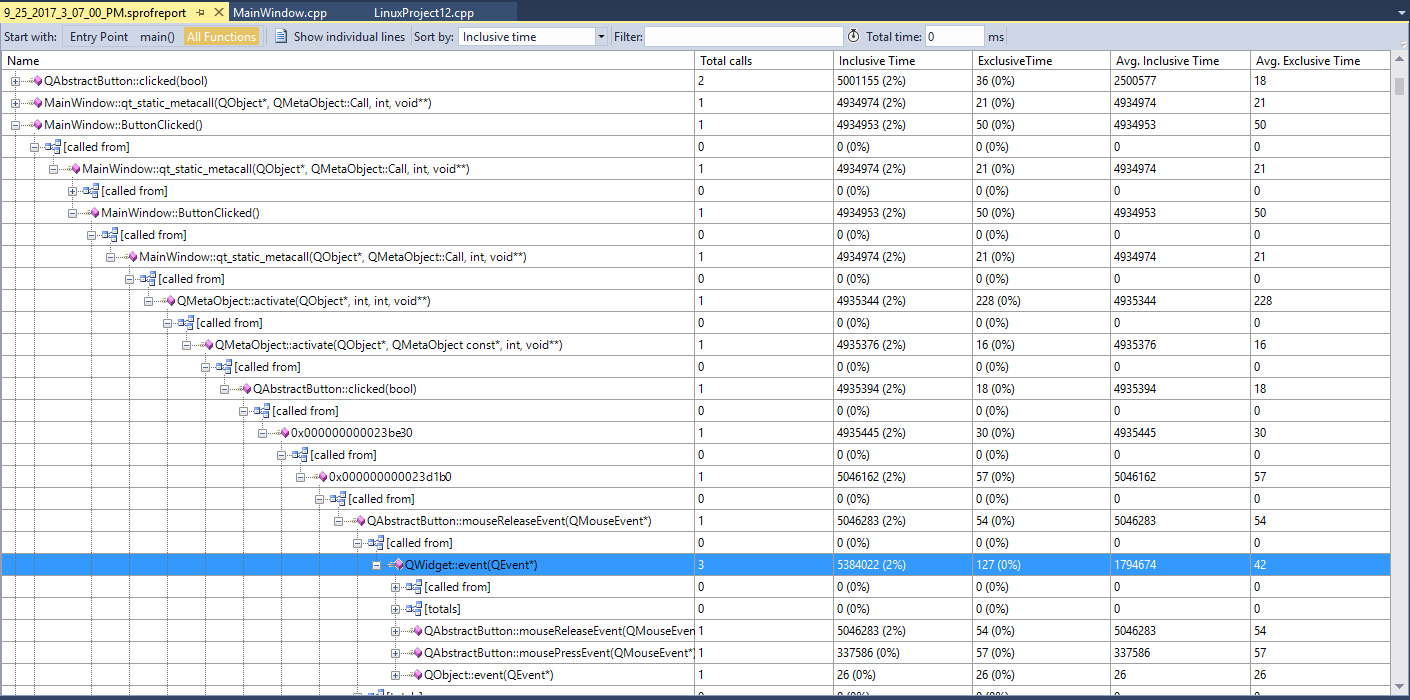
If profiling the entire program run slows it down too much, VisualGDB lets you turn the profiling on and off dynamically. Start in the “Debug and get ready to profile” mode, then step to the critical part of your program and enable profiling. VisualGDB will handle the low-level Valgrind commands automatically and let you view the relevant results:
Code Coverage
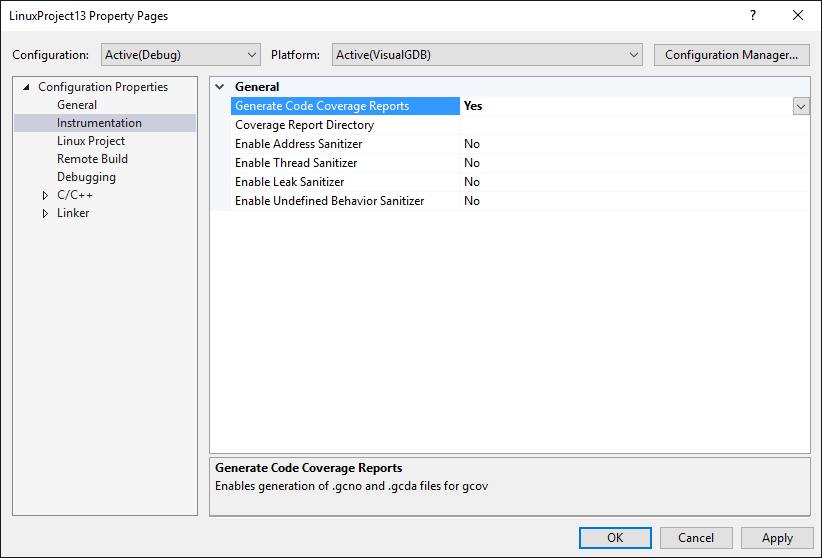
VisualGDB 5.3 RC1 also includes out-of-the-box support for code coverage. Simply enable the “Generate Code Coverage Reports” setting in your build settings and VisualGDB will automatically instrument your code for code coverage analysis with gcov:
Enable the “Build code coverage reports” option via VisualGDB Project Properties and VisualGDB will automatically locate, download and parse the coverage files and present you with an easily searchable structured report: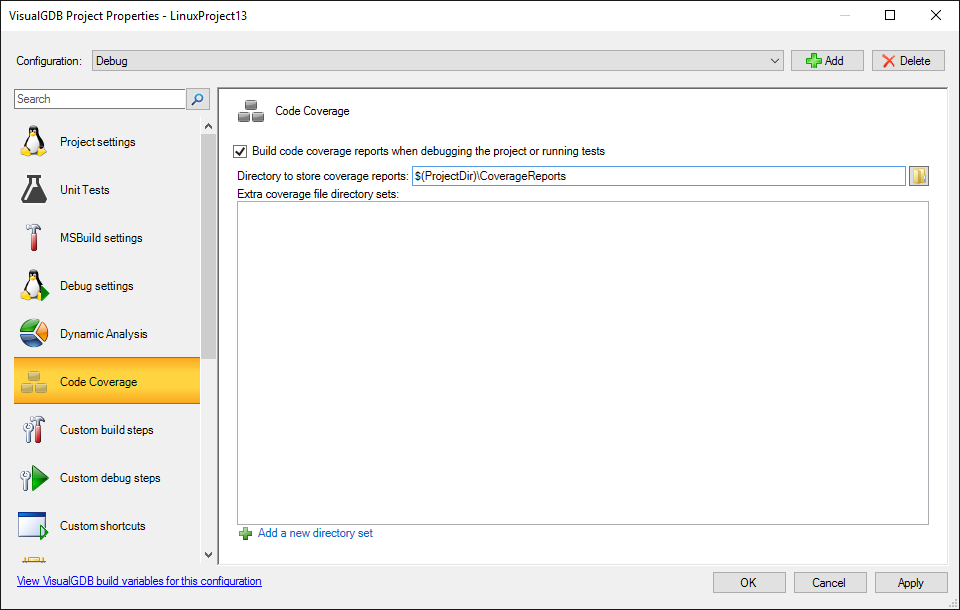
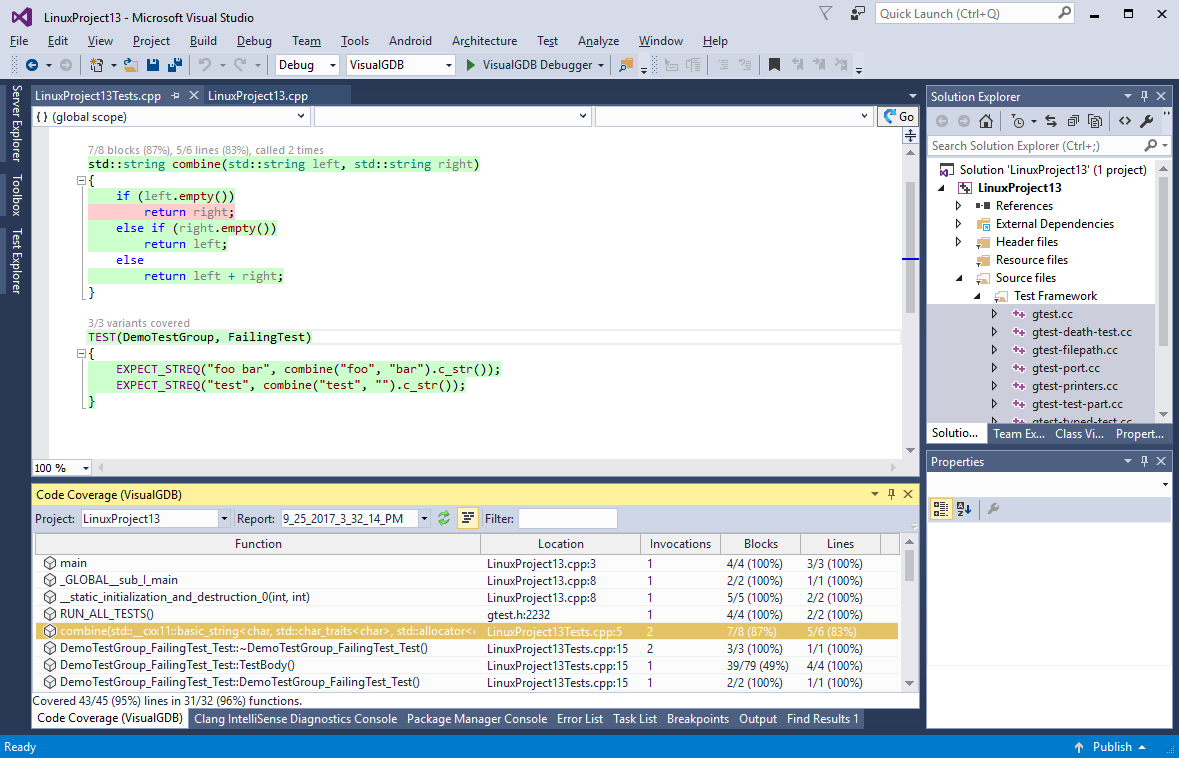
The coverage reports let you see detailed per-function statistics (in blocks and lines) and can quickly highlight the lines that were never executed during your test run so you can easily modify your tests to cover them:
Dynamic Analysis
We have also added support for detecting run-time memory and threading problems by using the Valgrind dynamic analysis tools. Simply enable dynamic analysis via VisualGDB Project Properties and you run your program under debugger: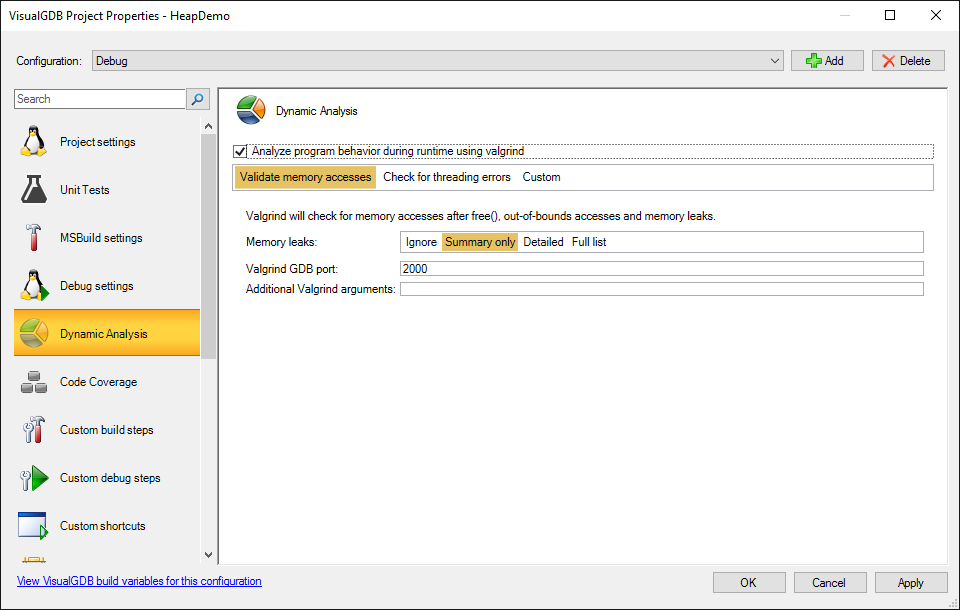 VisualGDB will automatically configure Valgrind to detect the selected type of issues and will show you details on each issue when it is detected:
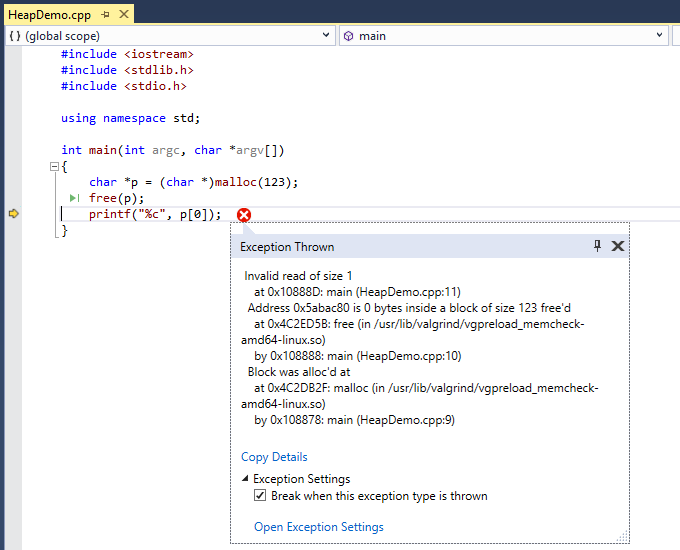
Embedded Memory Explorer Improvements
If you are using Visual Studio 2013 or later, VisualGDB will now display function sizes and stack usage (not recursively yet), directly in the code as long as the Embedded Memory Explorer window is active and the detailed view is enabled: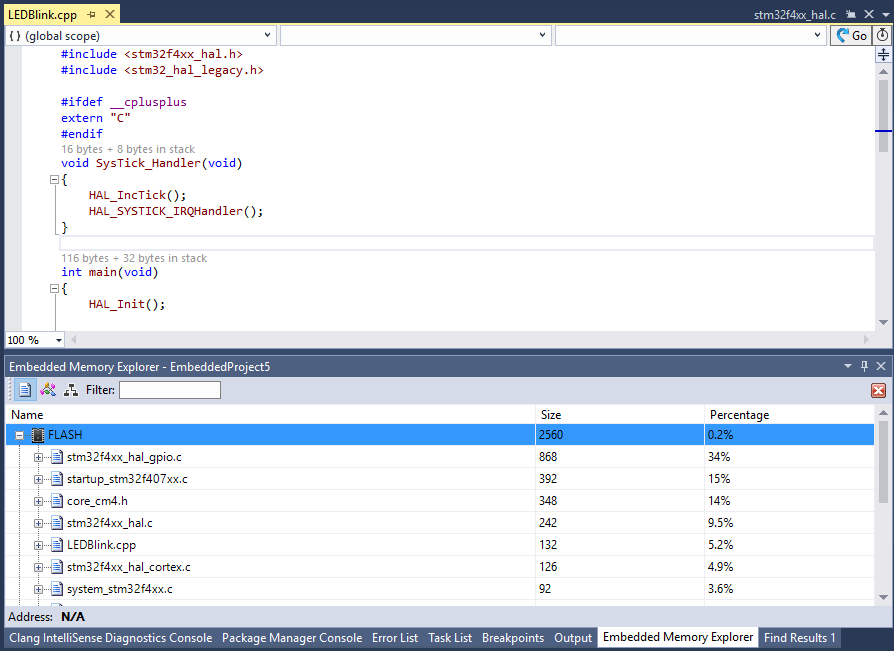
It will also show the sizes and offsets of various struct members so you can quickly troubleshoot forgotten alignment attributes or unexpected sizes: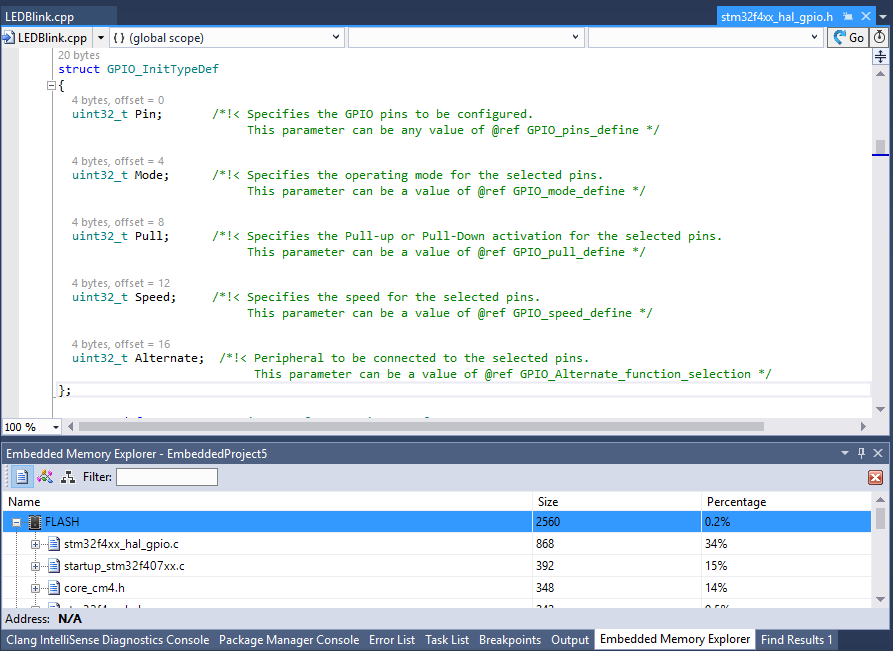
All information is taken from the actual ELF file, so it will 100% match the behavior of your program, even if the IntelliSense configuration has some settings incorrect.
Other Small Improvements
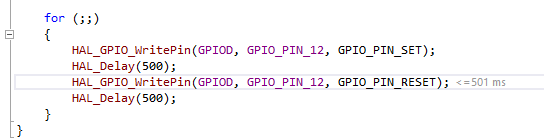
We have added a few smaller improvements to various components of VisualGDB. E.g. Advanced CMake Projects are now better integrated with TFS, automatic XMing launching is now more reliable and the toolchain selection GUI looks less confusing on high-contrast color schemes and the embedded chronometer will now display the time elapsed since last event directly in the code:
Try It Out
VisualGDB 5.3 RC1 is out. You can download it on this page and don’t hesitate to send us your feedback via the support form or forum so that we can make VisualGDB even better.