VisualGDB started supporting unit tests in version 5.2. Having out-of-the-box support for CppUTest, GoogleTest and TinyEmbeddedTest, VisualGDB made it easy to check whether every separable component of your system works. However the size overhead and the necessity to create a separate test project makes it hard to use them for testing the behavior of the entire embedded system.
So in VisualGDB 5.3 Preview 7 we introduced a new mechanism called Embedded Integration Tests that does exactly that – lets you conveniently verify the behavior of your firmware without any significant overhead.
Overview
Embedded Integration Tests let you modify the flow of the program using the debugger functionality (via commands like ‘Set Next Statement’ and ‘Set variable value’), record the program response and allow adding extra checks (e.g. verifying that a variable value falls within a certain range). You can create Embedded Integration Tests inside any embedded project by simply selecting Test->Record Embedded Integration Test: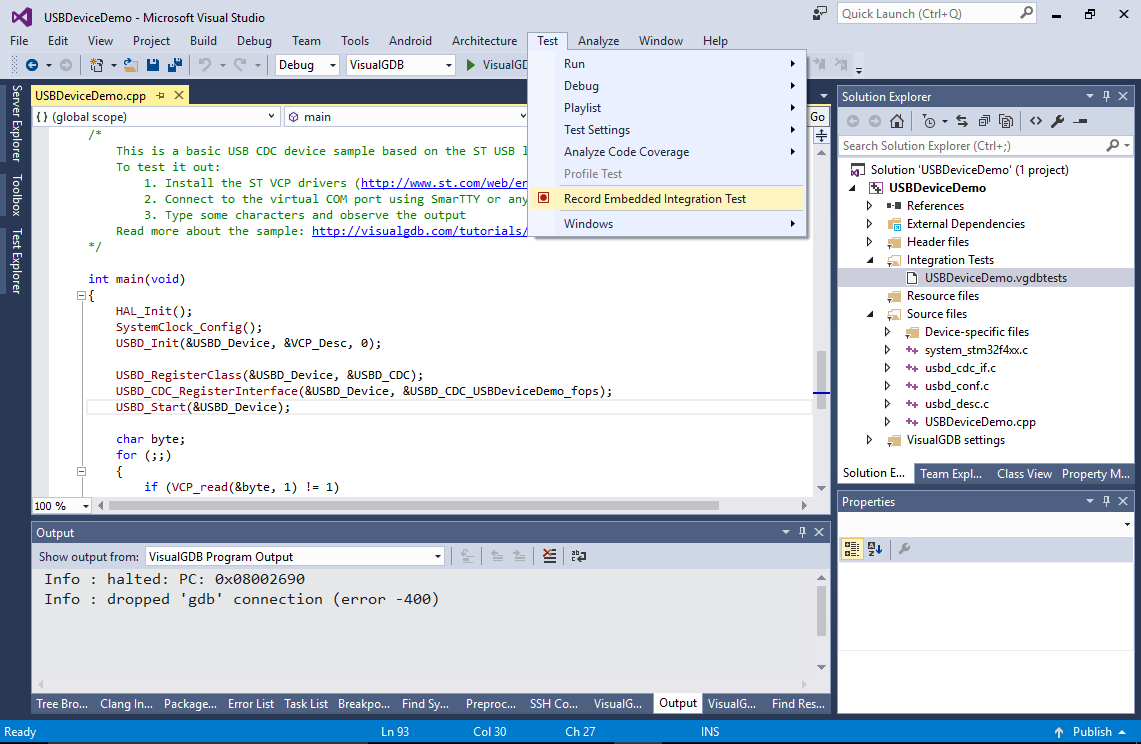
VisualGDB will automatically start a new debug session and will stop in the main() function. Now you can use the normal debugging functionality to make your program follow a certain path and check its consistency along the way. For example, you can:
- Ensure that the critical interrupt handlers get invoked and don’t get stuck.
- Set a breakpoint inside a critical function and ensure that the stack pointer does not exceed the expected limit.
- Use ARM Cortex performance counter to validate timing of the critical functions.
- Set a breakpoint in the function that checks for user input, imitate various input events by forcing the function to exit with different status codes and check that the program responds as expected.
- Step through some critical functions, simulate common error conditions by manipulating hardware registers, check that the errors are handled correctly.
Recorded Actions
VisualGDB will record (and replay when testing) the following actions:
- Setting, enabling/disabling and deleting breakpoints
- Resuming execution/stepping (and checking whether a specific breakpoint triggers)
- Running custom GDB commands (you can check their output with regular expressions)
- Modifying values of variables or hardware registers
- Setting next statement
Each time you create a breakpoint or use “Set next statement”, VisualGDB will suggest tagging the corresponding source line by adding a specially formatted comment: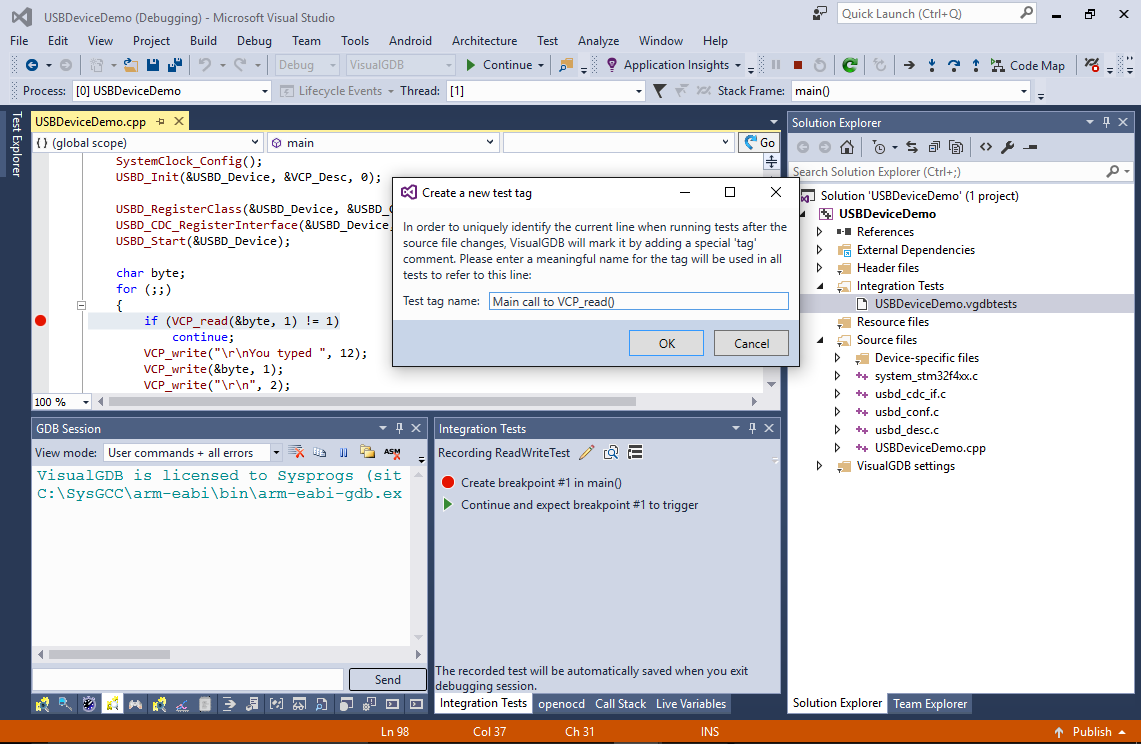
This comment will help VisualGDB locate this line when running tests even if the code in the line changes: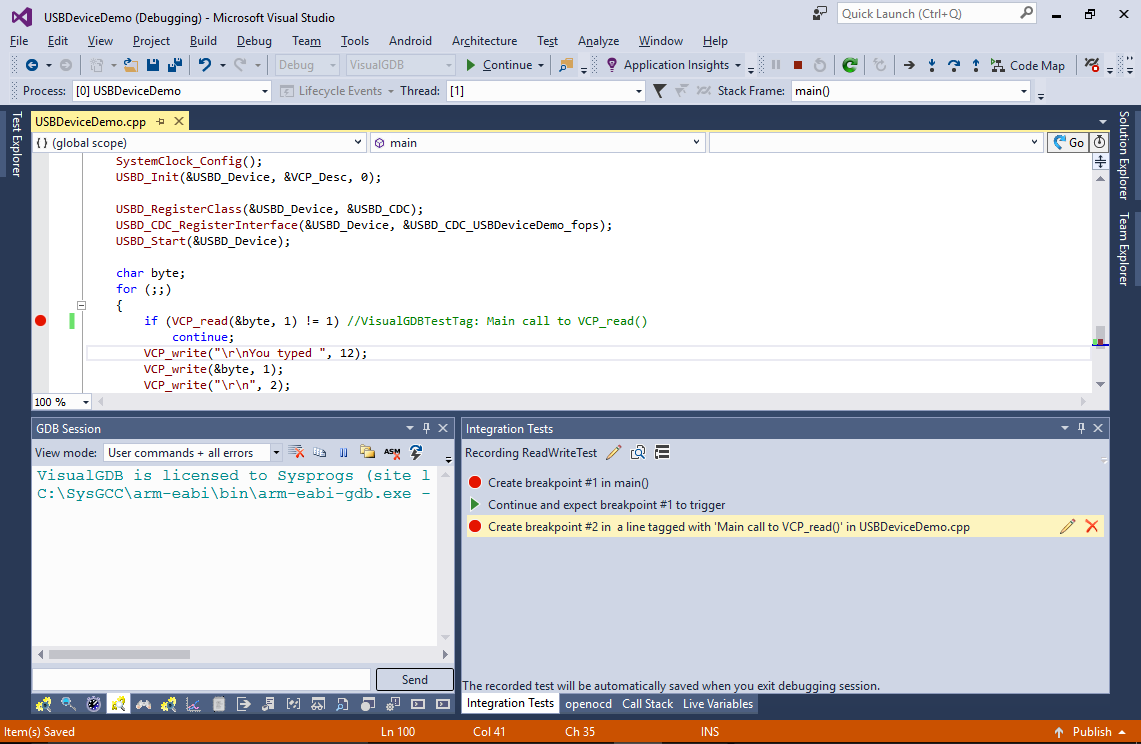
VisualGDB will show the recorded actions in the “Integration Tests” window and will let you edit them: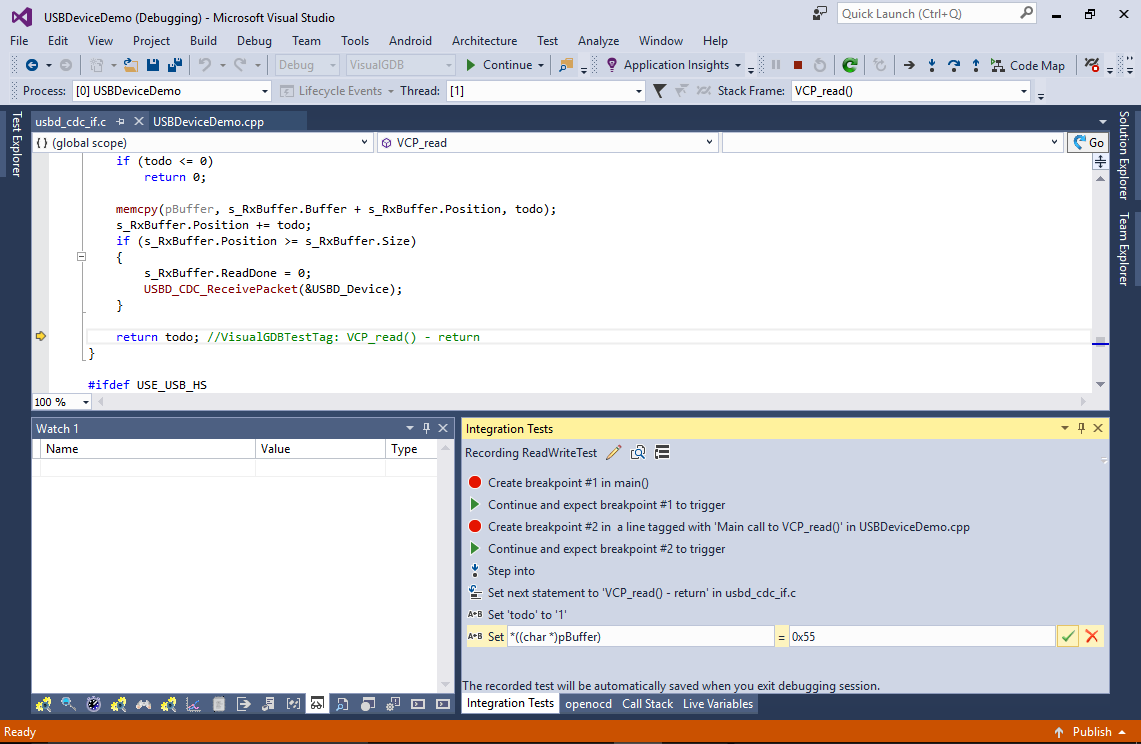
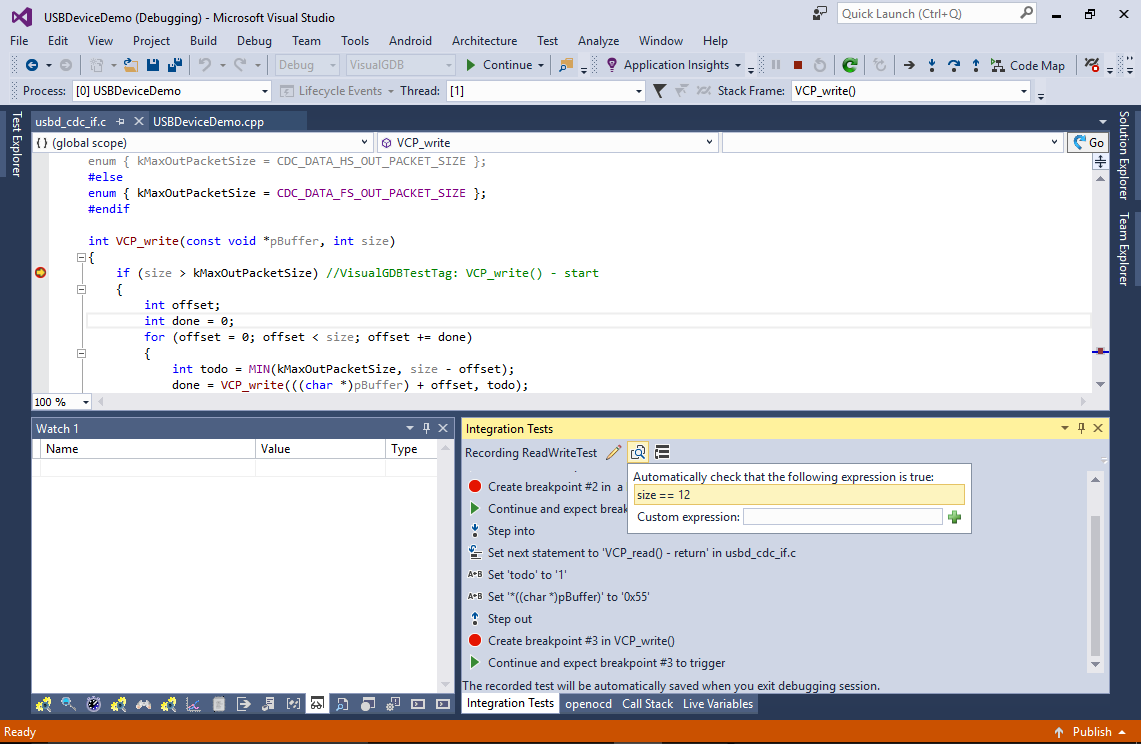
If you have just checked a variable value by hovering your mouse over it, you can tell VisualGDB to always check for the same value by adding a check. VisualGDB will automatically suggest recently evaluated expressions:
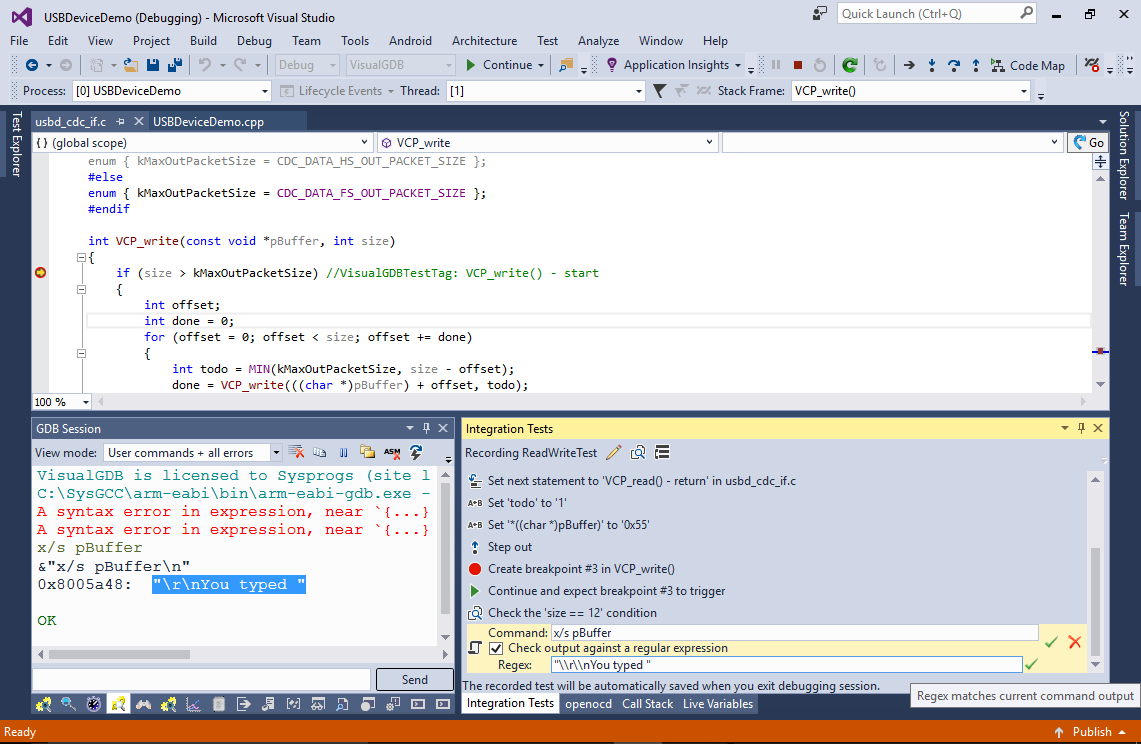
 You can also check the consistency of your program by running complex gdb commands and letting VisualGDB validate their output via regular expressions:
Editing and Running Tests
Embedded Integration Tests are stored in test set files (.vgdbtest) that are added to the project via Solution Explorer. You can view and edit the tests by simply opening the test set file in Visual Studio:
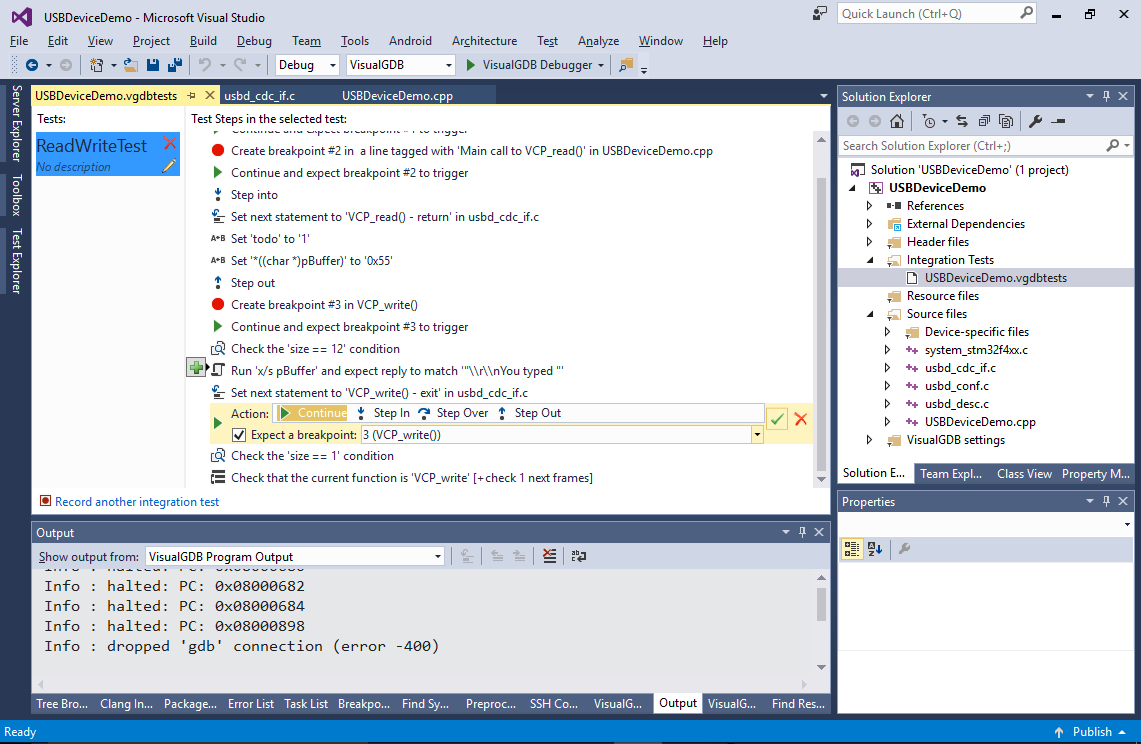
Tests from all sets included in a project will automatically appear in the Test Explorer letting you run them as if they were the regular unit tests: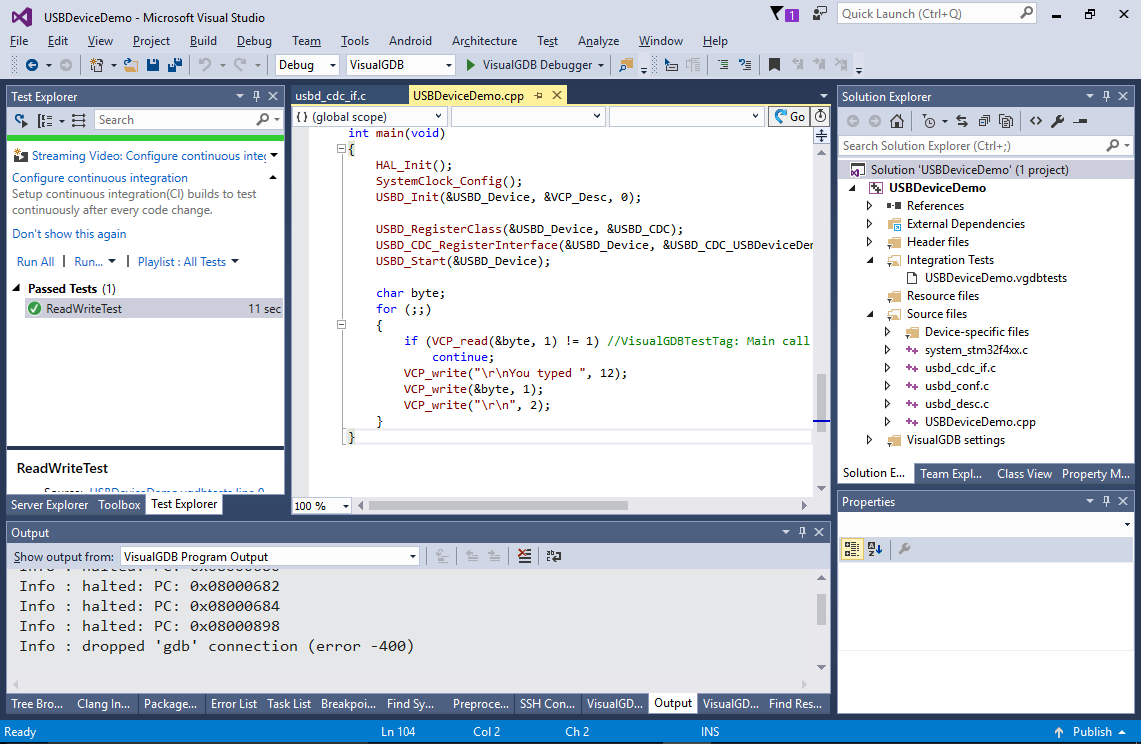
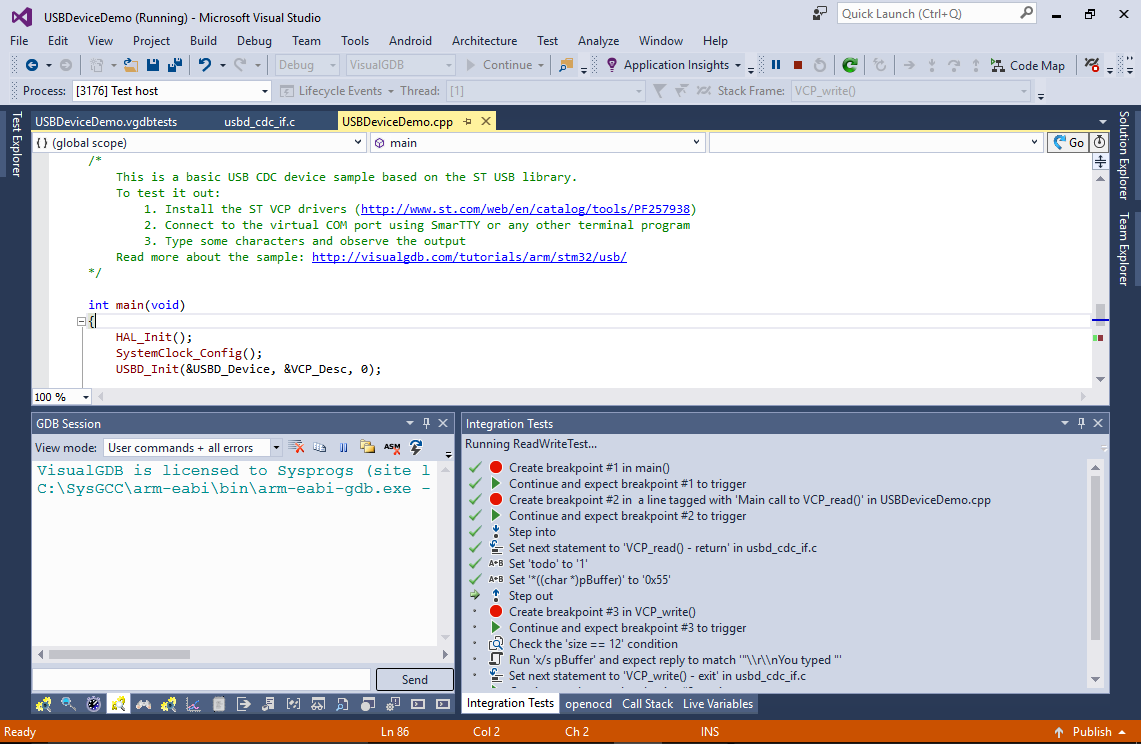
VisualGDB will conveniently display the progress of the currently running test and give the control back to you if it stumbles upon any inconsistency:
Give It a Try
You can download VisualGDB 5.3 Preview 7 here. As always, we appreciate your feedback, suggestions for more recordable actions and general ideas, so don’t hesitate to drop us a line via our support form or the VisualGDB forum.