Forum Replies Created
-
AuthorPosts
-
support
KeymasterHi,
Sorry, looks like the log file did not get attached. Could you please simply paste a few error messages in the post?
Most of the import-related errors arise from conflicts between the startup files used in the project and the startup files shipped with VisualGDB. If the errors mention “multiple definition of XXX”, simply looking up both files mentioned in the error and removing one of them from the project should help.
January 20, 2018 at 06:31 in reply to: Integrated Clang code analysis as build step possible? #13530KeymasterHi,
We have long-term plans for having a special command for scanning the entire project with the code analyzer and producing a fast searchable report, however currently the built-in analyzer only works for the currently edited file by showing the warnings in the Errors pane.
The best workaround would be the solution suggested by Ophidian14 – add a custom post-build step that would invoke the analyzer. For MSBuild projects you can configure this under C/C++ settings and VisualGDB will automatically launch the step for each source file, applying the regular compiler arguments.
KeymasterHi,
Thanks for clarifying. This is supported out-of-the-box for the regular ndk-build + Make project type (can be created via the Android Project Wizard), but not yet for CMake. We would advise simply creating a new command-line Android application via VisualGDB wizard and then adding your files to the project. You can also create a unit test project from the same wizard – VisualGDB will automatically setup the unit testing framework and forward the test results from the Android device to Visual Studio.
KeymasterHi,
Strange. Could you please open the Clang IntelliSense Diagnostics Console, switch to the Project View and paste the CXXFLAGS for the project shown there? This should help understand what exact flags are fed into clang.
January 20, 2018 at 06:25 in reply to: Problem switching from [Eclipse/GNU MCU] to [Visual/VisualGDB] #13527KeymasterHi,
As long as Eclipse and VisualGDB use different toolchains, the results might be slightly different (e.g. different optimization algorithms). Also using different input file order could affect the order of functions in the final image and might also trigger some strange bugs.
We would advise doing a quick test – replacing the ELF file generated by VisualGDB with the ELF file from Eclipse and trying a VisualGDB debug session without rebuilding. If this works, the problem is in the build settings (which is most likely, but still worth double-checking at this stage). Otherwise, it is related to debug settings.
Weird memory locations usually come from gdb doing some guessing while unwinding the stack and are usually harmless (exceptions caused by the debugger itself don’t invoke HardFault_Handler).
You can verify the FLASH automatically by adding the “compare-sections” command to the additional GDB commands in VisualGDB Project Properties or use the “Verify FLASH memory” button in the GDB Session window (this will display a detailed report on mismatches if any are found).
KeymasterHi,
The “Info : debug cause: 0x8” and other similar messages come from OpenOCD – the command line tool used for debugging; it is not directly related to the UART port output.
In order to see the UART output from esp8266, you would need to physically connect a USB-to-UART adapter to the UART pins on your module (please ensure you use a level translator, as UART and regular CMOS logic use different voltages and connecting them directly might burn one side). Once you connect it, you can see the UART output in the corresponding COM port (either via VisualGDB’s Embedded Terminal or using our free SmarTTY tool).
KeymasterHi,
OK, we have added a partial workaround to this. Please try this build: http://sysprogs.com/files/tmp/VisualGDB-5.3.18.2009.msi
You can disable template contents indentation via Tools->Options->Text Editor->C/C++ (VisualGDB)->Formatting->Don’t indent template contents.
VisualGDB will still add indentations when you press ‘enter’ after starting a template declaration, however they will be removed once you enter the final ‘;’ or reformat the entire document via Ctrl-K, Ctrl-D.
January 19, 2018 at 04:53 in reply to: Problem switching from [Eclipse/GNU MCU] to [Visual/VisualGDB] #13514KeymasterHi,
Thanks for the detailed description. This might be related to an OpenOCD bug in the STM32L4 driver that refuses to program some sections if they are insufficiently aligned (we were not able to reliably pinpoint it though). The file built with Eclipse shows the size of .isr_vector section to be 0x2f8, while the VisualGDB version has 0x2f4 (due to different size of mcu_cpu_systick_Handler). Please try increasing alignment of your sections and see if this works around the programming errors.
KeymasterHi,
Thanks, this looks like a bug fixed a few maintenance builds ago. Please update to the latest VisualGDB 5.3R8.
KeymasterHi,
No problem. Please let us know what are you trying to create a – stand-alone command-line Android tool, a native Android app or a Java App with C++ part built by CMake.
KeymasterHi,
Thanks for the screenshot. This type of output is processed directly by Visual Studio and should not be affected by any VisualGDB bugs. If you observe the same in Android Studio, this is likely a bug in Gradle.
KeymasterHi,
This is by design – VisualGDB normally keeps automatic rename smart tags for 3 last edits. You can disable this by setting this limit to 0 as shown below:
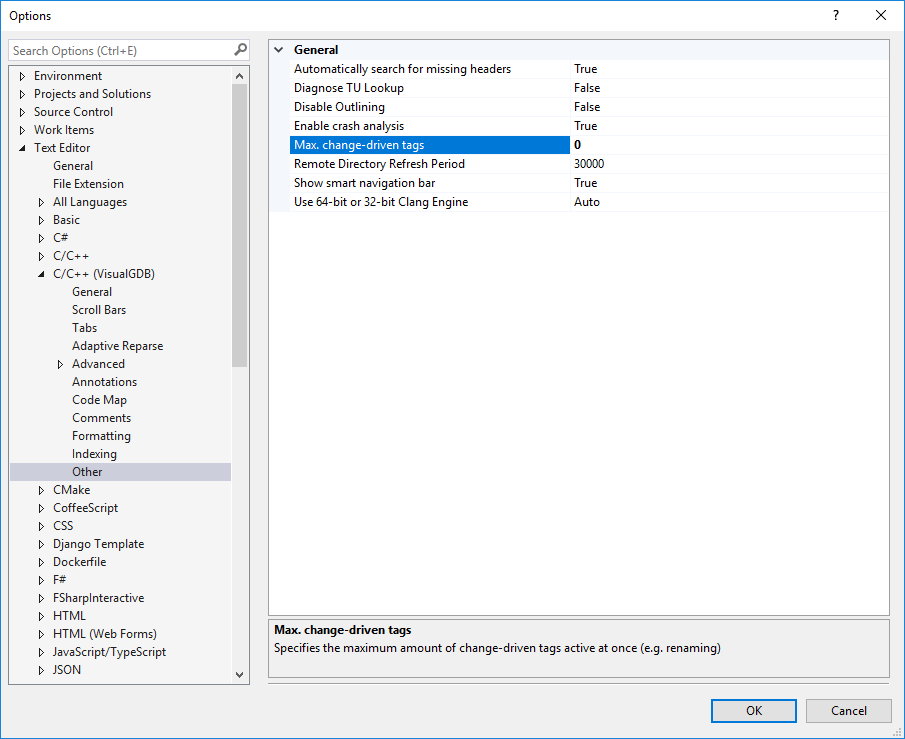
Please note that you would need to reopen your project after changing this setting.
Attachments:
You must be logged in to view attached files.KeymasterHi,
Normally the Clang IntelliSense should automatically pick this flag from the project settings. If not, please try adding it to VisualGDB Project Properties -> IntelliSense Settings -> Additional flags for C++ files.
January 19, 2018 at 04:10 in reply to: nRF52 – steps for logging via RTT to free up UART pins #13507KeymasterHi,
As we are not a vendor for Segger RTT, unfortunately we cannot provide much help for this. For VisualGDB projects we recommend using our advanced semihosting framework (enabled via the Embedded Frameworks page of VisualGDB Project Properties). It provides fast non-stop semihosting (including support for multiple colors via the ANSI escape sequences), is fully integrated with VisualGDB and doesn’t need any extra setup.
KeymasterHi,
Thanks, this might be related to a recently fixed bug. Please try this build: http://sysprogs.com/files/tmp/VisualGDB-5.3.18.2008.msi
-
AuthorPosts