Forum Replies Created
-
AuthorPosts
-
support
KeymasterHi,
This looks like a configuration problem on your Raspberry Pi. Please try using a clean SD card image and installing Qt on top of it, or follow these instructions on repairing libEGL permissions.
KeymasterHi,
Looks like the underlying build process produced some errors that are not recognized by Visual Studio. Please use the View->Output window to see the entire build output and check it for error messages explaining what is going on.
KeymasterHi,
It looks like your support period has expired. To keep on receiving technical support please renew your support here: https://sysprogs.com/splm/mykey
KeymasterHi,
Yes, sorry it got delayed due to changes in kernel debugging of Raspberry Pi 3 vs. Raspberry Pi 2 . We have a relatively stable pre-release build available here: http://sysprogs.com/files/tmp/VisualKernel-3.0.1.2043.msi
We are still figuring out the last details and are expecting to release a beta this week.
KeymasterHi,
Thanks for the example. We have just tried reproducing this on a clean VS (with a native C++ project), but unfortunately could not get the same behavior. Perhaps the behavior you are describing is caused by a 3rd-party add-in (e.g. Visual Assist?).
Either way, we could add an option for choosing what gets selected when you type “something->” or “something.”, although this would get a relatively low priority and will be included only in one of the late builds of v5.4.
KeymasterHi,
If closing all windows doesn’t help, please also ensure you don’t have the “show threads in source” option enabled. It would also result in Visual Studio querying all VisualGDB threads.
If you are not sure how to interpret the log file to find the critical paths from the timing perspective, please feel free to attach the log here (or send it to our support email) and we can check it for common problems.
The error message you mentioned looks like a gdb/gdbserver bug. Trying a different version of gdb might solve this.
KeymasterHi,
Sorry, this won’t work as VisualGDB would still try to specify “-G Makefile” internally. As a workaround, please modify the .vgdbsettings (or .vgdbcmake) file as shown below:
<Build xsi:type="com.visualgdb.build.cmake">
    <!-- ... -->
    <CMakeMakefileType>Ninja</CMakeMakefileType>
</Build>
We do agree that this workaround is inconvenient and will include a GUI setting for this in the next major update.
KeymasterHi,
Sorry, this is not yet supported, although is planned for the upcoming VisualGDB 5.4.
KeymasterHi,
No problem, we will try to provide an example.
Both VisualGDB and Visual Studio distinguish between the full match and partial match (see below):
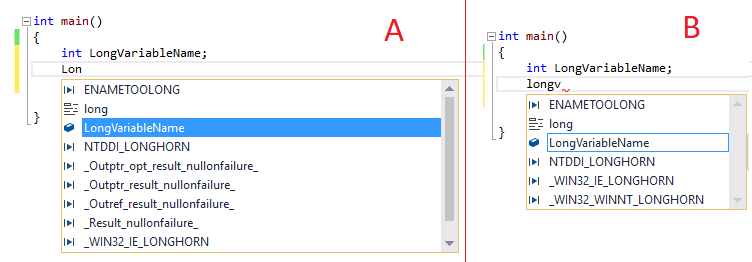
Pressing enter with a full match (A) will substitute its value. Pressing enter with partial match (B) will create a new line.
Attachments:
You must be logged in to view attached files.KeymasterHi,
Good to know it works. If you encounter further issues, don’t hesitate to create another topic.
KeymasterHi,
Sorry, we currently don’t have specific plans for supporting CMake-based stand-alone Android executables. The good news is that you can easily add multiple files and subdirectories to a VisualGDB project via Add->Add Existing Item->Import Folder Recursively.
January 23, 2018 at 06:58 in reply to: Problem switching from [Eclipse/GNU MCU] to [Visual/VisualGDB] #13553KeymasterHi,
You could try changing the file order by manually editing the .vcxproj file, however there might be other minor differences between the 2 toolchains. We would advise trying to understand the potentially impactful differences between the projects (e.g. section size/alignment) instead, as making the output 100% identical may be impossible in reasonable time.
Different mapping should not affect the “Reset_Handler” behavior. Although it might interfere with debugging (VisualGDB will try several workarounds to restore the broken mapping though), it should allow understanding whether the problem is caused by debug settings or some ELF file properties.
With the weird memory location, to answer that definitively you would need to look into the Segger J-Link stub internals to see what kind of filtering they internally use. In our experience this error message comes up frequently when starting debugging and it never interferes with the actual program flow. Also explicitly trying to read invalid memory via debugger doesn’t trigger the fault handler.
You can add the extra commands via VisualGDB Project Properties -> Additional GDB commands.
KeymasterHi,
The “breakpoint-modified” message simply means that a breakpoint was either bound or unbound when a module containing the corresponding code was loaded/unloaded. Normally it should not reduce debugging speed.
You can try enabling diagnostic GDB logs on the Advanced GDB Settings page of VisualGDB Project Properties – the advanced gdb logs contain timestamps for each line received from gdb and allow understanding the timing.
It also looks like VisualGDB is querying stack traces for all threads in your example – this could considerably slow down stepping through the code. Please try closing the “threads” window in Visual Studio and VisualGDB will only query the stack trace for the current thread.
KeymasterHi,
The “communication failure” errors almost always indicate wiring problems. Please double-check your board schematics, soldering/connections and try lowering JTAG frequency.
This could be also caused by your firmware disabling the JTAG pins at runtime. If the problem disappears after erasing the FLASH memory contents, please try using the “connect under reset” checkbox.
KeymasterHi,
Thanks for your feedback. VisualGDB tries to follow the Enter key behavior from the regular VS projects – Enter substitutes the selected suggestion if it matches the entered text (the list item will be highlighted in a solid color) or creates a new line if it doesn’t match the text (the selection will have a border around it instead of a solid highlight). You can use the ‘Tab’ key to substitute the best possible suggestion regardless of whether it matches the entered text.
Regarding formatting options, VisualGDB inherits most of the regular Text Editor->C/C++ settings that apply to the regular C++ projects (including spaces inside brackets). If it looks like they are ignored, please double-check that the regular VC++ projects have a different formatting style. If this is the case, please post the screenshot of your settings and both formatting results and we will investigate.
-
AuthorPosts