Forum Replies Created
-
AuthorPosts
-
support
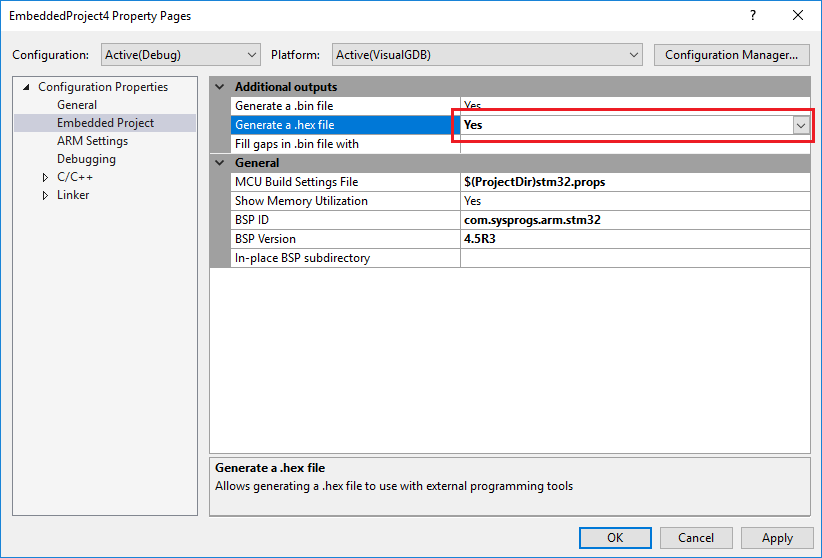
KeymasterHi,
You can disable the regular semihosting via VisualGDB Project Properties -> Embedded Project -> Implementations for _sbrk(), etc. -> Minimal (no semihosting).
You also need to remove the reference to the advanced semihosting/profiler framework via the Embedded Frameworks page.
February 13, 2018 at 01:27 in reply to: Beginners problem: Python debugging on remote machine #20074KeymasterHi,
OK, please try this build: http://sysprogs.com/files/tmp/VisualGDB-5.4.1.2058.msi
Please also follow the instructions in this tutorial to work around the optimization bug in the original Python 3 package.
KeymasterHi,
The easiest way to handle this would be by adding custom build rules. We have a tutorial describing a similar process for integrating the Qt GUI compiler; the steps for flex/bison should be very similar.
KeymasterHi,
The easiest way to work around this is to create a separate pseudo-project (e.g. using the Custom project wizard), that will copy the root directory to the Linux machine, and reference it from the other projects. Let us know if you need more details on setting this up.
February 13, 2018 at 00:07 in reply to: Clang vs Visual Studio Intellisense (issues with Clang) #20067KeymasterHi,
This could be caused by several different issues. If you could attach a screenshot of this, we might be able to pinpoint and fix the problem.
February 13, 2018 at 00:06 in reply to: How can I enlarge the font for VisualGDB settings dialog? #20066KeymasterHi,
Sorry for the confusion. By “Project Properties” we meant the first page of VisualGDB Project Properties (the exact name depends on the project type you are using, e.g. “Linux Project”). If you could attach screenshots of the first page and the Advanced GDB Settings page of VisualGDB Project Properties, we should be able to determine which parts of the GUI have the scaling problem.
February 13, 2018 at 00:04 in reply to: Licence. New Dev Machine after 1 year of support ends #20065KeymasterHi,
VisualGDB indeed only fetches the packages that are compatible with the version you are running, however we won’t be able to keep the old versions of the packages accessible forever due to size constraints. If you are planning to use VisualGDB well past the expiration of the update period, please ensure you make your own copies of all related files, so you won’t rely on our servers to fetch them.
KeymasterHi,
Sorry, VisualGDB doesn’t provide any console-only commands for managing toolchains (you can install them via the VisualGDB Package Manager though). Please feel free to describe your setup so that we could suggest a better workaround.
KeymasterHi,
The new toolchain should not flash any other file apart from esp_init_data_default.bin. You can also disable the esp_init_data_default.bin flashing by setting the “FLASH Initialization file” under the advanced settings to an empty string to see if the new programming step affects the problem.
February 12, 2018 at 23:07 in reply to: How can I specify the additional include dir relative to the solution dir? #20060KeymasterHi,
For most of the cases we would advise simply using relative paths (e.g. ../SolutionDir). The relative paths are always interpreted relatively to the project directory.
February 12, 2018 at 23:05 in reply to: How can I enlarge the font for VisualGDB settings dialog? #20059KeymasterHi,
Sorry, this is currently not supported. We will integrate VisualGDB with the regular VS font settings as a part of converting the VisualGDB Project Properties window to the WPF framework (we are gradually doing this across several releases). As a quicker workaround, we could add an option to override the default font size manually.
Before we can do that, could you please check whether the issue only affects WinForms settings pages (e.g. Project Properties), or does it also affect the WPF settings pages (e.g. Advanced GDB Settings)?
KeymasterFebruary 10, 2018 at 18:35 in reply to: Clang vs Visual Studio Intellisense (issues with Clang) #20040KeymasterHi,
We are not aware of anything like this, however we can still help you pinpoint it. Next time you observe the issue please try switching the IntelliSense engine to the regular VC++ one and back (via the Clang IntelliSense Diagnostics Console). Does this resolve the issue? If not, does reopening the source file resolve the issue, or is restarting VS the only way to solve this?
February 10, 2018 at 18:33 in reply to: Licence. New Dev Machine after 1 year of support ends #20039KeymasterHi,
The deactivation requests are handled on a case-by-case basis, but we do handle them even for licenses with expired support (please note that you will only be able to install the VisualGDB versions released within a year from your license purchase; we also advise making backups of all BSPs/toolchains/debug packages as the newer versions are not always compatible with older VisualGDB releases).
KeymasterHi,
OK, we have double-checked this and it looks like our programming plugin indeed did not load the init data file correctly in some cases. We have fixed it in the R14 toolchain relesae available here: http://gnutoolchains.com/esp8266/
You can program the FLASH memory without debugging via Debug->Program Firmware without Debugging.
-
AuthorPosts