Forum Replies Created
-
AuthorPosts
-
support
KeymasterHi,
No problem. Indeed, when using Segger J-Link, VisualGDB would try to parse the esptool command line, reconstruct the FLASH memory layout from it and then load it using the OpenOCD’s commands. This mechanism is relatively fragile, so it might indeed not work in some cases.
In order to track this down, please try the following build: VisualGDB-5.5.1.3314.msi
Then open View->Other Windows->VisualGDB Diagnostics Console and try programming the memory using J-Link.
Once the memory is programmed, please locate the following lines in the diagnostic log:
- Parsing esptool command should show the command line of the esptool used by the Arduino build system.
- com.sysprogs.esp32.esptool.binaries.count and subsequent lines should show the FLASH structure reconstructed from the command line. Please check it for any obvious inconsistencies compared to the command line.
- ExecuteRawCommand(mon program_esp32, <…>, CLI) lines will show the actual FLASH programming commands issued by VisualGDB to OpenOCD. They should match the FLASH memory layout in the esptool command line.
If you can point out a specific part of the esptool command line that gets parsed incorrectly, it should be very easy for us to fix it. However, if it’s not that obvious, we would need you to collect more information:
- Erase the FLASH memory using esptool.py.
- Program the memory using the “Arduino tools”.
- Read back the FLASH memory using esptool.py.
- Erase the entire memory again
- Program it using J-Link.
- Read it back via esptool.py
- Compare the results (e.g. using fc.exe /b).
- Finally, post the entire diagnostic log from VisualGDB and the results of the comparison to this thread, or send it via our support form so that we could double-check everything on our side.
P.S. It would also be great if you could either update your forum profile to match the email used in the license key, or send it via our support form so that we could internally link it to your forum profile.
KeymasterHi,
No problem. Although fixing the Espressif’s GDB executable is outside of what we can offer as a part of VisualGDB, we have updated our Arduino project subsystem to allow editing common build parametersvia the regular VS Properties so that you could try the workaround described in the Github issue. Please try this build: VisualGDB-5.5.1.3313.msi
Then open VS Project Properties for the Arduino project, go to C/C++ -> Optimization and set Inline Functions to No. This should affect both the main sketch and the libraries, working around the problem.
KeymasterHi,
You can open the Threads view using the Debug->Windows->Threads command in Visual Studio
The VisualGDBExtensibility.dll library is shipped with VisualGDB (normally C:\Program Files (x86)\Sysprogs\VisualGDB\VisualGDBExtensibility.dll). Simply add it as a reference to the project referencing it and you should be able to build it.
KeymasterHi,
Indeed, the VisualGDB’s startup file looks different from the original one. Our BSP generation logic parses the interrupt vector list from the original file and generates a compatible startup file that has the same interrupt vector definitions, but is also compatible with VisualGDB-specific parameters (e.g. FLASH/RAM memory layout).
The linker script is also regenerated based on the memory map. This enables GUI-driven features like “fixed-size stack/heap”, however would indeed break 3rd-party tools that expect specific sections in the ELF image. Using the original ELF file instead should fully solve the problem.
The stack error is shown because the original linker script places the __StackLimit symbol at the beginning of RAM, while most SDKs from other vendors place it to the end of RAM:
  __StackTop = ORIGIN(RAM) + SIZEOF(.stack_dummy);
  __StackLimit = ORIGIN(RAM);
The easiest way to work around this would be to locate the EndOfStackSymbol element in the .vgdbsettings file and manually change its contents to __StackTop to match the name used in the EFM32 linker script.
KeymasterSorry, this is actually an issue caused by a recent change in the way Visual Studio reports its color settings to language services like the one used by VisualGDB.
Please try the following build, it already contains a fix for it: VisualGDB-5.5.1.3311.msi
October 18, 2019 at 22:22 in reply to: CMSIS-DAP device showing up multiple times and debug fails #26227KeymasterThanks for the update. This could be caused by another issue – one of the recent GDB updates changed the way the command-line arguments must be escaped and it looks like our OpenOCD toolchain did not specify it correctly. It may cause issues when trying to pass command-line arguments with spaces (such as -c “xxx yyy zzz”).
We have updated our OpenOCD toolchain package one again resolving the issue. Please feel free to reinstall it, or to simply add the ArgumentEscapingMode line to toolchain.xml as shown below:
<?xml version="1.0"?>
<Toolchain xmlns:xsi="http://www.w3.org/2001/XMLSchema-instance" xmlns:xsd="http://www.w3.org/2001/XMLSchema">
    <...>
    <ArgumentEscapingMode>Advanced</ArgumentEscapingMode>
</Toolchain>
Please also ensure you are using the latest VisualGDB build: VisualGDB-5.5.1.3311.msi
You can verify the arguments seen by OpenOCD by setting a breakpoint in main and evaluating “*argv@argc” in the Watch window (it will expand *argv to a fixed-size array of size argc). If the arguments still don’t match what is specified in VisualGDB Project Properties, please let us know.
If the arguments are correct, but OpenOCD still does not work, please let us know if you are able to step into openocd_main(), i.e. if the source line mapping and variable evaluation are working.
October 18, 2019 at 21:58 in reply to: ESP-IDF, arduino as component : Where to place third party librairies ? #26221KeymasterHi,
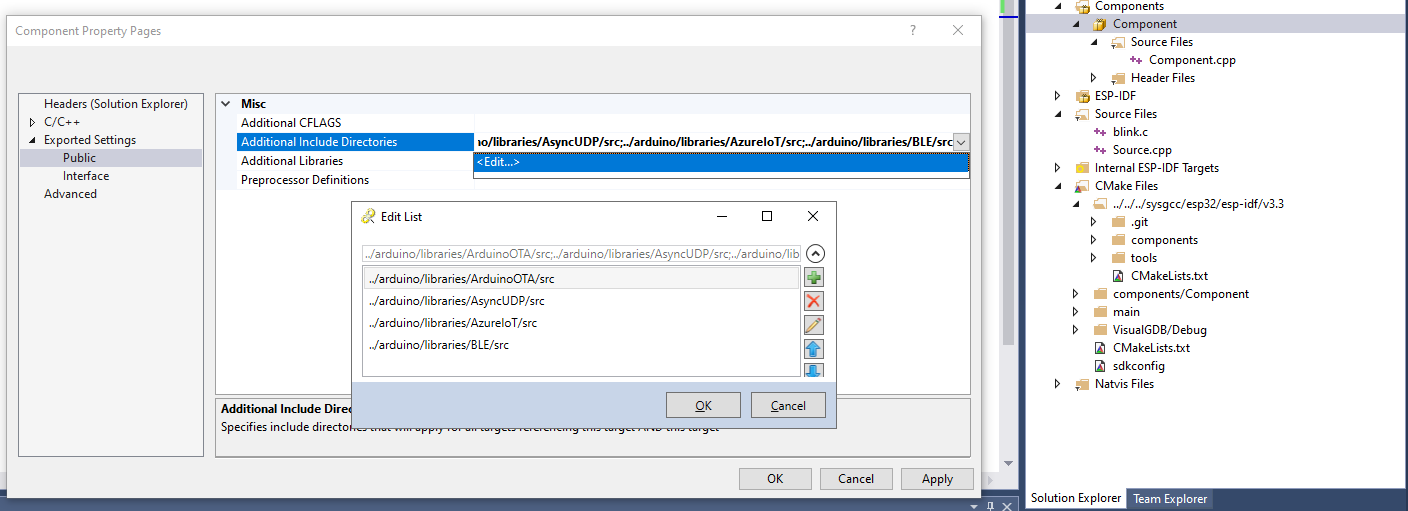
Good to know it works. As promised, below are the details on setting this option using the VisualGDB GUI.
- Select the component in Solution Explorer (or the project itself if you are editing the main component).
- Right-click on it and select “Properties”.
- Use the Exported Settings -> Public -> Additional Include Directories property to interactively edit the directory list:
Attachments:
You must be logged in to view attached files.KeymasterPlease try obtaining the call stack of the main Visual Studio’s thread as shown here: http://visualgdb.com/support/callstack and share it in this thread along with the VisualGDB build number. This should explain what is going on.
KeymasterThis is rather strange, as normally OpenOCD should not suddenly switch to another board.
In order to troubleshoot this, please check if the problem can be reproduced outside VisualGDB, with just one OpenOCD instance running. If not, please try understanding what set of circumstances triggers the problem (e.g. 2 OpenOCD instances are running and VisualGDB confuses the TCP ports of them).
If the problem happens with just 1 instance reliably, please double-check whether using the same command line (having the serial number hardcoded), but actually unplugging the second device changes anything. Please also let us know what exactly you observe when the call to ProgramAsync() jumps to the second board. Perhaps, something else is happening to the board that looks like it’s trying to run ProgramAsync().
Edit: there could be another source of issues when using multiple ST-Link adapters of different versions. Because historically OpenOCD had different internal drivers for ST-Link 1, 2 and 2.1, VisualGDB internally treats them as separate incompatible devices. So if you have just one instance of ST-Link v2 and one instance of ST-Link v2.1, VisualGDB would assume that each interface is unique and would not pass the serial number to OpenOCD. As OpenOCD now considers both devices equivalent, this would let it pick one interface arbitrarily. That said, it should happen at the beginning of the debug session and not between erasing and programming the FLASH memory.
We have also added a “Pass the USB serial number to OpenOCD even if just 1 device is present” setting to our OpenOCD GUI (VisualGDB Project Properties -> Debug -> Advanced) that will override the default serial number behavior. Please feel free to install the OpenOCD update via the VisualGDB Package Manager and enable the new setting.
-
This reply was modified 6 years, 5 months ago by
support. Reason: mentioned the new OpenOCD setting
KeymasterSorry, this is a limitation of the way Clang performs C++ parsing. At the time the lambda body is parsed, the template argument deduction for any_of() hasn’t happened yet, so “f” is not yet resolved. Specifying it explicitly indeed provides enough information for auto-completion.
KeymasterThanks for pointing this out. Indeed, the older ST-Link v2 do not report the serial number in a USB-compliant way and hence the stock OpenOCD doesn’t properly work with multiple instances of them.
The ST’s branch of OpenOCD uses very non-trivial modifications to its USB logic to support querying the serial number using a vendor-specific hack, however those changes were never merged into the mainstream OpenOCD and may break compatibility with other debug probes (hence our OpenOCD fork doesn’t include them).
As the issue only affects the older ST-Link 2.0 devices (not St-Link 2.1 or 3.x), we suggest simply moving on to the newer St-Link 2.1 (that uses newer firmware and also typically has a built-in COM port).
October 17, 2019 at 17:32 in reply to: Example Tutorial for OpenCV using Python and VisualGDB #26207KeymasterHi,
Sorry, we do not have a Python tutorial for OpenCV and have not explicitly tested this scenario yet.
KeymasterSorry, the first issue looks like you are trying to debug an STM32 device that is not supported by OpenOCD yet. Ynfortunately, OpenOCD relies on a hardcoded list of STM32 device IDs in order to detect the FLASH parameters. ST usually contributes push requests to the OpenOCD repository providing the updates, and then our packaging system picks them up, but that typically takes a few months since a new device is released.
It is also hard to say why the external NOR FLASH driver would be failing. If it’s using our OpenOCD FLASH driver plugin system, we can suggest a few things to check. However if it is something that comes with OpenOCD, our best advice would be to build a debug build of OpenOCD from sources and try stepping through it in order to understand what is going on.
Another option would be to switch from ST-Link to Segger J-Link. It is more expensive than ST-Link, however it allows Segger to maintain and regularly update their own proprietary replacement to OpenOCD that does not have many of the USB driver issues known to OpenOCD and also typically introduces support to new devices much faster than open-source tools like OpenOCD. VisualGDB supports both OpenOCD and the Segger J-Link debug stack the same way, so simply select J-Link in the Debug Settings once you plug it in and VisualGDB will switch the existing project to use it.
October 17, 2019 at 17:23 in reply to: ESP-IDF, arduino as component : Where to place third party librairies ? #26204KeymasterArduino libraries use a rather specific sematics (including one header file automatically pulls the entire library) and hence only work out-of-the-box with the Arduino project builder. This is fully supported and works out-of-the-box when using the Arduino Project Subsystem.
The ESP-IDF projects are based on a different framework that is not 100% compatible with the Arduino ecosystem. It is possible to add the Arduino core to ESP-IDF projects because Espressif has specifically designed their ESP32 core to be both a valid Arduino core and a valid ESP-IDF component that can be imported into ESP-IDF projects. This does not mean that any Arduino library can be automatically added to ESP-IDF projects without any adjustments, because the ESP-IDF build system is still different from the Arduino build system.
In order to import an Arduino library to an ESP-IDF project, it needs to be manually converted to an ESP-IDF component. Once you have performed the conversion, you can add the component to the project by selecting Add->Existing Item in Solution Explorer->Project->Components.
October 16, 2019 at 22:22 in reply to: ESP-IDF, arduino as component : Where to place third party librairies ? #26188KeymasterSorry, if you need help understanding the role of libraries and components in ESP-IDF projects, please contact Espressif for further support.
We can help you locate specific VisualGDB settings that correspond to specific properties of the components, however we are not able to offer help understanding the inner workings of ESP-IDF or other 3rd-party frameworks that are not directly maintained by us.
-
AuthorPosts