Today we have released another preview of VisualGDB 5.5 introducing improvements to various project types. In this post I will give you an overview of the main highlights of the new build.
Better Dependency Management
VisualGDB is integrated with a vast ecosystem of toolchains, drivers, frameworks and other packages. While VisualGDB would previously install them automatically when creating new projects, opening existing projects would often require setting up missing parts manually. VisualGDB 5.5 Preview 2 introduces a new system of load-time checks that automatically detect and repair most known dependency issues: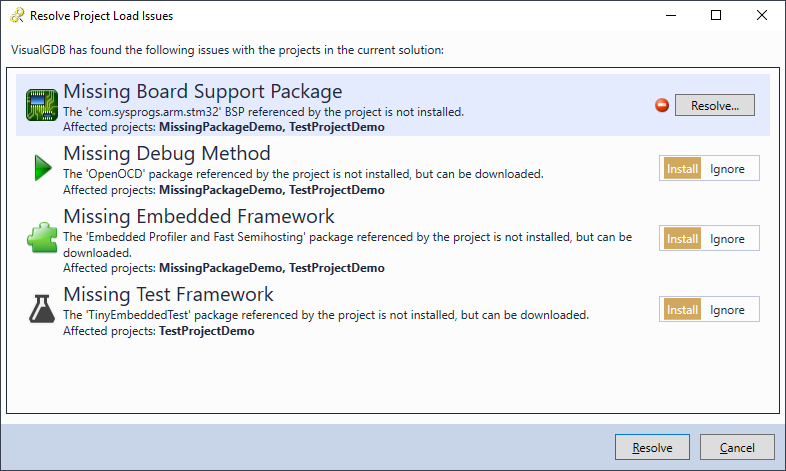 Each time you open a solution, VisualGDB will scan it for compatible projects and show you one easy-to-use window allowing to:
- Install missing toolchains, BSPs, debug packages, test frameworks, or substitute them for other versions.
- Create missing remote host connections, or substitute them solution-wide.
- Install missing CMake, Python or Mbed packages.
- Repair inconsistent toolchain profiles and MSBuild properties.
- Install required Arduino platforms or libraries.
The new version also allows ignoring specific package updates and switching embedded projects to use a private copy of the BSP inside your source control system instead of the regular system-wide BSP.
Live Code Coverage
VisualGDB 5.5 Preview 2 introduces a new Embedded Code Coverage engine. It automatically moves most of the coverage computation on the PC side, reducing the performance and memory overhead on your target by over 10x. This opens up new ways of debugging real-time code without introducing unnecessary delays that can be useful in much more scenarios than just unit tests: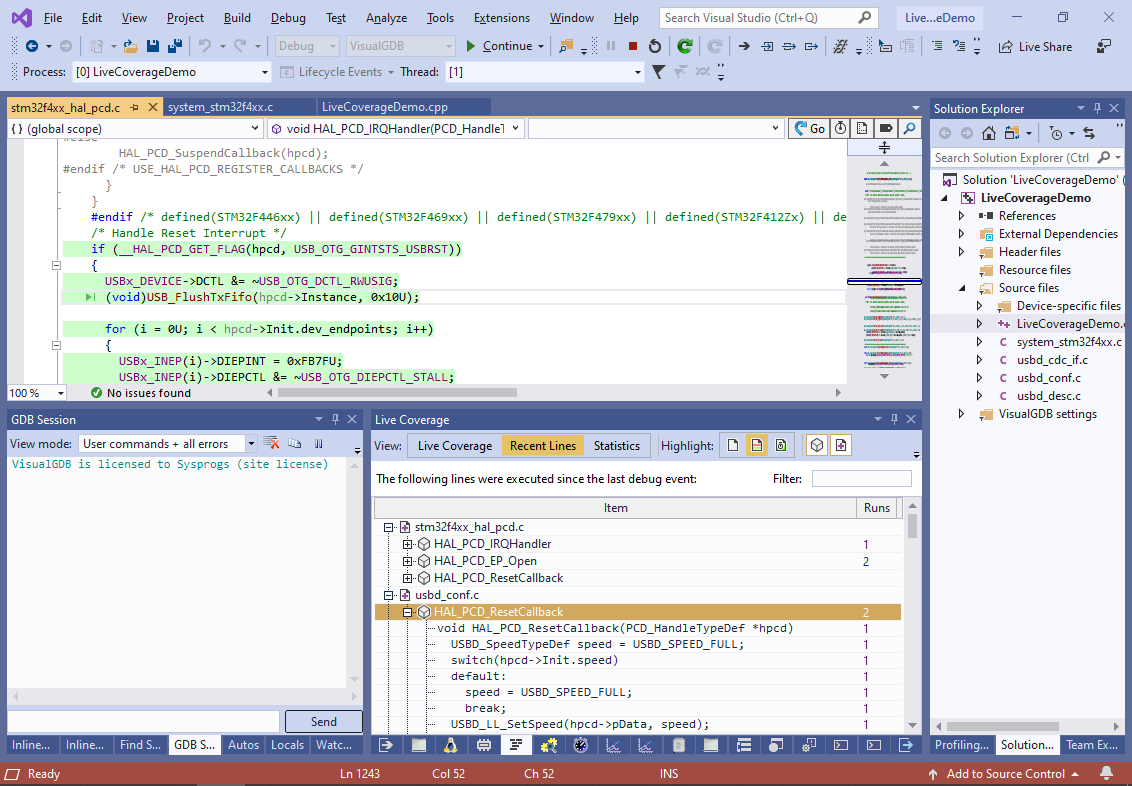
With the Live Coverage enabled, you can now instantly see all the lines and functions executed between 2 breakpoints, or as you stepped over a call. Or you can keep your program running and just check the recently executed lines and functions in the Live Coverage Window. VisualGDB can even highlight the recently executed lines so you could see what exactly your firmware is doing.
Unlike the embedded profiler that explicitly reports each executed function to the host, code coverage simply updates function/branch counters in your target’s memory, letting VisualGDB read them in the background. This has a much smaller performance impact compared to the full-scale profiling, and can show individual source lines in addition to just functions.
Mbed Unit Tests
VisualGDB 5.5 Preview 2 fully supports Mbed unit tests. Simply create mbed test binaries via the commands in Solution Explorer and VisualGDB will let you use the familiar Test Explorer window to manage them: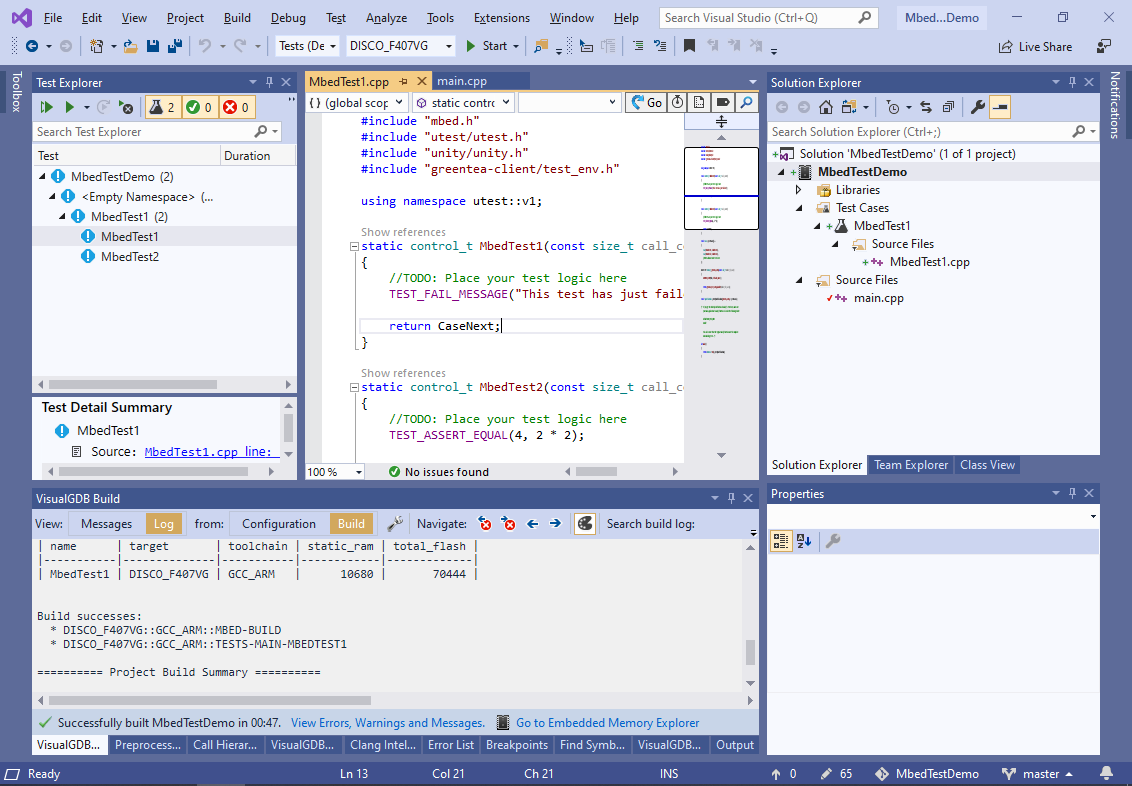
Unlike the regular mbed testing workflow, VisualGDB allows selecting individual unit tests inside any subset of binaries. It will automatically load the involved test binaries one after another and ensure that only the selected tests get to run. If a test fails, VisualGDB will automatically capture the full stack trace of the error and will optionally reset the device, restarting the remaining tests, so you won’t need to do this manually.
Multiple WSL Distro Support
If you are using the WSL (Windows Subsystem for Linux) as a lighter alternative to Virtual Machines, you will no longer be limited to just the default WSL distro. VisualGDB can now automatically detect all installed WSL distributions and let you pick a specific one when creating or editing projects: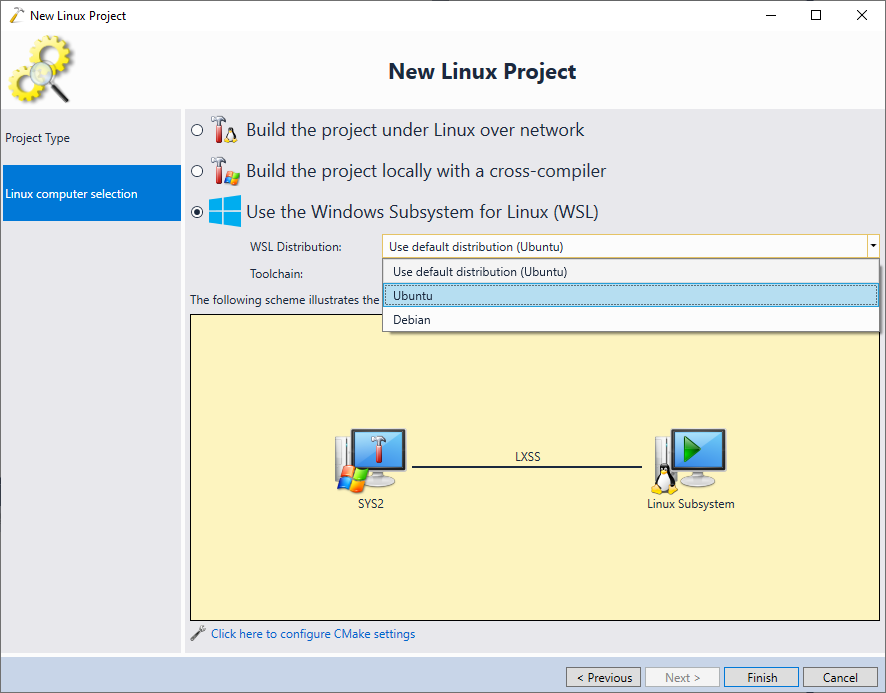
There’s More
You can find the full change log of the new VisualGDB 5.5 Preview 2 on this page. Simply download and run the new installer from the download page and it will automatically pick up the settings and projects from your previous VisualGDB installation.
If you have any questions or other feedback, don’t hesitate to reach out to us via our support form or the VisualGDB forum.