Forum Replies Created
-
AuthorPosts
-
support
KeymasterUnfortunately, it is hard to suggest anything specific based on the description you provided.
In order for us to provide any help with this, we need to be able to reproduce the problem on our side.
Please provide complete and detailed steps to reproduce the issue as described below:- The steps should begin with launching Visual Studio. They should include every step necessary to create the project from scratch and reproduce the issue.
- Please make sure the steps do not involve any 3rd-party code as we will not be able to review it. If the problem only happens with a specific project, please make sure you can reproduce it on a clean project created from scratch. See this page for more information and detailed examples.
- The steps should include uncropped screenshots of all wizard pages, VisualGDB Project Properties pages and any other GUI involved in reproducing the problem. This is critical for us to be able to reproduce the problem on our side.
You can read more about the best way to report VisualGDB issues in our problem reporting guidelines, If you do not wish to document the repro steps and save the screenshots, please consider recording a screen video instead and sending us a link to it.
KeymasterHi,
We are not aware of any known issues that would be causing it. One other customer mentioned that a recent update of a debugging tool (they didn’t specify which one) broke the logic for setting the initial stack pointer, so instead of pointing to the end of RAM, it would point to a random location. That said, we were never able to reproduce it on our side.
Either way, you can easily narrow it down by following the steps below:
- Enable GDB logging.
- Run a debugging session and ensure it crashes.
- Locate the following lines in the log file:
- target remote :<port>
- load
- continue
- any commands starting with ‘mon’ or ‘monitor’ that are forwarded straight to the GDB stub
- Try running OpenOCD or J-Link manually, then run gdb manually and execute the same commands.
- If the crash persists, try running “mon reset” (J-Link) or “mon reset halt” (OpenOCD) after the “load” command.
- If it solves the problem, please try checking the value of sp (print (void *)$sp) before and after the ‘load’ command.
If you can confirm that running “load” with J-Link breaks the value of $sp, please feel free to report it to Segger support. They should be able to fix it on their side.
If the issue is caused by something else, you can use the “reset device after programming” checkbox in VisualGDB Project Properties -> Debug Settings. It will automatically insert the reset command after the load command. You can also customize the exact commands VisualGDB sends to gdb via the Advanced view on the same page.
KeymasterNo worries, it looked like a great feature to add.
We’ve added the tag display in the selected interface field to the following build, feel free to try it out: VisualGDB-5.6.109.4823.msi
KeymasterHi,
You can try fully closing the window and reopening it. That said, we recently updated the column resizing logic to only apply once the mouse button is released. It should help avoid the original problem in the first place. Feel free to try this build: VisualGDB-5.6.109.4822.msi.
KeymasterHi,
The Debug->Windows->RTOS Objects view is likely provided by another extension. VisualGDB reports the RTOS threads via the regular thread interface, so they can be viewed via Debug->Windows->Threads.
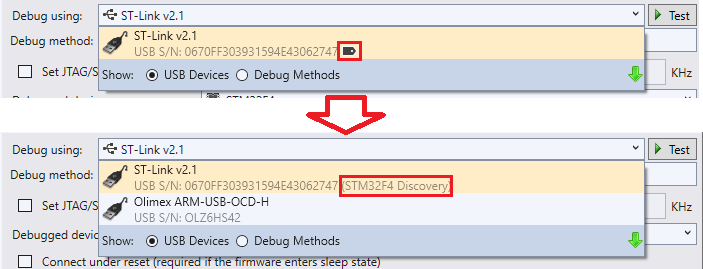
KeymasterOK, we have added support for debug interface tags to this build: VisualGDB-5.6.109.4816.msi. You can now click the tag icon next to the serial number and VisualGDB will allow entering an arbitrary tag that will be associated with this specific device and always displayed in the list:
Attachments:
You must be logged in to view attached files.February 20, 2023 at 15:51 in reply to: Additional ARMASM arguments in Keil settings not working. #33870KeymasterThanks, this indeed looks like a bug in the logic that prevents the incompatible armclang options from being passed to armasm. We have fixed it in the following build: VisualGDB-5.6.109.4816.msi.
You can also apply the patch on your side without reinstalling VisualGDB by locating the following statement in the %VISUALGDB_DIR%\MSBuild\Targets\gcc.targets file:
<ItemGroup Condition="'$(GNUToolchainSubtype)' == 'armclang'">
	<ClCompile Condition="'%(ClCompile.IsAssemblyFile)' == 'true'">
		<AdditionalOptions/>
	</ClCompile>
</ItemGroup>
Then, you would need to change the <AdditionalOptions/> line to this:
<AdditionalOptions>$(ARMASMArguments)</AdditionalOptions>
KeymasterHi,
The Preprocessor Definitions option should work just fine. If you cannot get it working, please feel free to provide the repro steps per our problem reporting guidelines, and we will do our best to help you.
KeymasterHi,
Thanks for the suggestion, it indeed looks like a useful feature. We will look further into it and will post an update here next week.
February 16, 2023 at 05:39 in reply to: ESP32 Debugging failed with Visual Studio due to FLASH programming #33858KeymasterIf you are changing the command line in VisualGDB project properties, rather than running VisualGDB manually, you do not need to specify the gdb port. Simply use -c “init; halt; esp appimage_offset 0x20000” instead of init; halt” -c “esp appimage_offset 0x20000” that you tried before. Please also make sure there is a space before -c.
February 16, 2023 at 05:19 in reply to: ESP32 Debugging failed with Visual Studio due to FLASH programming #33856KeymasterHi,
Sorry for the confusion. The correct command line should be:
C:\Users\bope02\AppData\Local\VisualGDB\EmbeddedDebugPackages\com.sysprogs.esp32.core\bin\openocd.exe -c “gdb_port 54502” -c “telnet_port 54500” -f interface/ftdi/esp32_devkitj_v1.cfg -c “adapter_khz 3000” -f target/esp32.cfg -c “init; halt;esp appimage_offset 0x20000” -c “echo VisualGDB_OpenOCD_Ready”
You can also do this:
-c init -c halt -c "esp appimage_offset 0x20000"
February 15, 2023 at 20:05 in reply to: Visual Studio using default (non-visualgdb) text editor for header files #33854KeymasterThanks, we have reproduced the problem and found the root cause.
When CMake introduced a new optimized format for reporting CFLAGS for source files, we added a translation layer that allowed VisualGDB to handle both old and new formats. Turns out, the translation layer was not properly handling the sources that didn’t have any CFLAGS attached to them. This would only affect solutions with both VisualGDB and non-VisualGDB projects, and only when CMake would use the new code model format.
Either way, we have fixed the issue in the following build: VisualGDB-5.6.109.4813.msi
February 14, 2023 at 14:40 in reply to: Visual Studio using default (non-visualgdb) text editor for header files #33851KeymasterThanks for clarifying this. CMake projects indeed handle the header files differently (depending on how CMake reports them and a few other settings), so some combination of settings might prevent IntelliSense from prioritizing them over the VS project.
We should be able to fix it promptly if you could create a simple repro case – a solution containing:
- A basic Win32 C++ project referencing the header
- A basic CMake-based project referencing the header the same way your current setup does it
If you can confirm that the problem persists in the repro solution, please try packing it into an archive and attaching it here (or using a file hosting service). BTW, the easiest way to check whether a file is using Clang IntelliSense is via the “Go” button on top of the file (see this page).
February 14, 2023 at 13:55 in reply to: Visual Studio using default (non-visualgdb) text editor for header files #33849KeymasterHi,
Thanks for renewing your support.
If the solution contains multiple projects and you open a header (or source file), VisualGDB checks which of the projects explicitly reference that file. If the file is explicitly referenced by a non-VisualGDB project and not referenced by a VisualGDB-based project, it will let Visual Studio handle IntelliSense.
The workaround is extremely straight-forward: simply include the file in question in your VisualGDB-based project (Add->Existing file in the context menu). Since header files are not built directly, this won’t affect the build process, but will make sure VisualGDB uses the Clang IntelliSense engine when editing this file.
February 14, 2023 at 08:25 in reply to: ESP32 Debugging failed with Visual Studio due to FLASH programming #33847KeymasterHi,
It should normally not be necessary – in our tests OpenOCD managed to find everything automatically. Either way, please follow the steps below to resolve it:
- Try starting a debug session. Take a note of the OpenOCD command line at the beginning of the Debug->Windows->VisualGDB Output window.
- Try adding -c “esp appimage_offset 0x20000” at the end of the Command Line setting under VisualGDB Project Properties -> Debug Settings -> Advanced Settings (bottom of the page). You should not normally need the “init; halt” part.
- Try starting another debug session. Take a note of the updated command line in the VisualGDB Output window.
- If this does not resolve the problem, please try adding the “init; halt” part as well.
If the problem is resolved, please share the full command line so that we could look further into it and make sure VisualGDB handles it automatically.
-
AuthorPosts