Forum Replies Created
-
AuthorPosts
-
support
KeymasterHi,
Normally the log will be displayed once you click “details”. Most likely this happened because some files from the old toolchain (e.g. the debug plugin) were in use by VisualGDB.
Please try closing all Visual Studio instances and installing the toolchain manually: http://gnutoolchains.com/esp32/
Please also note that the latest toolchain requires VisualGDB 5.3 Preview 5 as it relies on the new mechanism for embedded debug packages.
KeymasterHi,
It’s not particularly hard, although the process it not documented and not officially supported. The embedded frameworks come from 2 sources:
- BSP.XML files under %LOCALAPPDATA%\VisualGDB\EmbeddedBSPs define frameworks that come with the BSP
- EFP.XML under %LOCALAPPDATA%\VisualGDB\EmbeddedEFPs define frameworks that can be used for all embedded devices regardless of the BSP
All our code responsible for generating BSPs (including the frameworks) is actually open-source and is available here: https://github.com/sysprogs/BSPTools/, hence you can try modifying some of the existing BSP generators to generate custom framework packages.
Regarding ChibiOS, it currently looks much less popular than other RTOSes like FreeRTOS, so we don’t have any plans of supporting it directly. If it becomes more popular, we will reconsider this. However currently you would need to create the framework manually in order to support this OS out-of-the-box.
KeymasterHi,
Yes, the problem happened because the fine-grained indentation of the function arguments happened on the different level than the coarse-grained indentation of the statements.
We have fixed this in the following build: http://sysprogs.com/files/tmp/VisualGDB-5.3.5.1708.msi
KeymasterHi,
Sure, we have just released it: http://visualgdb.com/download/ (use the “try preview” button).
After installing we recommend updating the debug packages via Tools->VisualGDB->Manage VisualGDB Packages. This will install updates that significantly improve the OpenOCD and Segger J-Link debug experience.
KeymasterHi,
Looks like there is a confusion about the “stm32f2x” vs “plugin” driver. The “stm32f3x” driver is a built-in OpenOCD driver that is only capable of programming the regular on-chip FLASH memory. Hence if you specify “stm32f2x” in your command, OpenOCD will try to use that driver and fail.
The “plugin” driver is a special driver only supported by our OpenOCD fork that will load your ELF file (that must include certain symbols) into the device and call functions from it to program the memory. The error message in one of your previous posts actually contained a clipped line “Invalid FLASH plugin”. Please switch back to using “plugin”, get that message to appear and check the rest of that message. It should provide a clue on why the ELF plugin could not be loaded and resolve the errors mentioned there in order to get it working.
August 6, 2017 at 05:20 in reply to: FreeRTOS compile error: instruction not allowed in IT block — 'msr psp, r0'… #11938KeymasterHi,
Good to know it works. If you encounter further errors, feel free to contact us again.
KeymasterHi,
Thanks for the detailed description. We have rechecked this and can confirm that it is a bug in the latest VisualGDB version. The behavior we got was different, although the error you observed could be caused by the same problem. Some samples from the Nordic SDK like SAADC can only be compiled with the softdevice disabled and VisualGDB did not properly override the softdevice setting manually selected on the MCU selection page. We have fixed this in the upcoming v5.3 Preview 5. As a workaround please try disabling the softdevice manually via VisualGDB Project Properties.
Please also update your nRF5x BSP to the latest version (13.0r3) as previous BSP versions might handle this incorrectly.
KeymasterHi,
Yes, please refer to the instructions in this post: https://sysprogs.com/w/forums/topic/using-the-quadspi-on-stm32f7-discovery/
KeymasterHi,
No problem. According to our records, you already have the Custom edition, so you should be able to use the post-build commands. Please refer to the screenshot below:
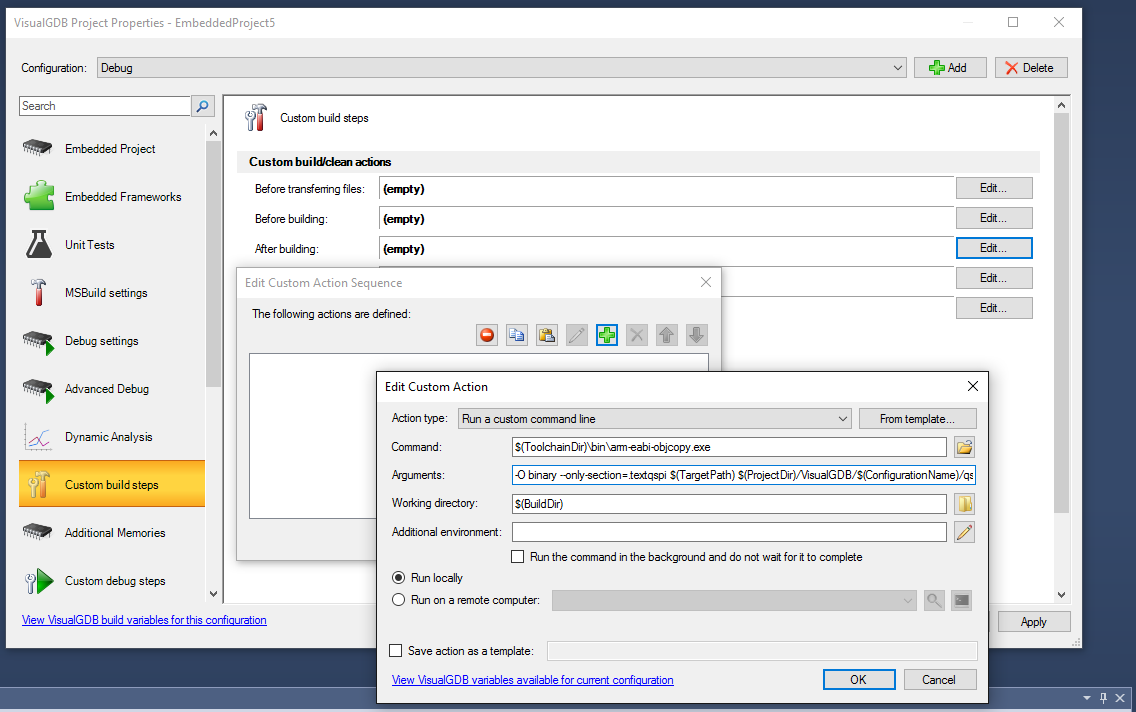
Please select VisualGDB Project Properties -> Custom Build Steps -> Actions after building -> Edit -> Add -> Run a custom command line.
Then locate the objcopy binary from your toolchain and enter the arguments with the adjusted input and output file paths. We recommend using variables like $(TargetPath) and $(ProjectDir) to avoid hardcoding the paths. The objcopy command will read the input ELF file (first argument after –only-section), locate the .textqspi section inside it and dump it into a .bin file (second argument after –only-section). Please ensure that the input file path matches the path of the ELF file built by your project so that objcopy can process it correctly.
Attachments:
You must be logged in to view attached files.KeymasterHi,
We are sorry about your experience. We have just retested this by creating a new project for Nordic nRF528232 with the SDK 13.0 and manually enabling the power module and could not get any error. The line mentioning NRF_POWER_THRESHOLD_V23 compile successfully and IntelliSense is able to find the definition correctly.
Perhaps you have imported the project in a way that lets a 3rd-party Makefile control the build and the Makefile itself contains errors? We would be happy to help you if you could let us know how exactly have you created the project so that we could reproduce this on our side.
KeymasterHi,
Yes, this Makefile saves the contents of the ExtFlashSection to extflash.bin. If you want to convert the project into a MSBuild-based VisualGDB project, you would need to add the objcopy command to the custom post-build actions to achieve the same result.
KeymasterHi,
If you want to generate a project with 2-way synchronization, we recommend using MSBuild (the first option). However please note that it will not automatically import all of the settings like preprocessor macros, so you would need to specify them manually after importing.
KeymasterHi,
It looks like the MSI file is corrupt. Please try re-downloading it and ensure that you have administrator permissions on that machine (and that your antivirus is not accidentally blocking access to the MSI file).
KeymasterHi,
Thanks for clarifying this. We have replied with further details to the support ticket you opened.
KeymasterHi,
No problem. If you encounter any issues, feel free to post here and we will help.
-
AuthorPosts