Forum Replies Created
-
AuthorPosts
-
December 21, 2017 at 18:09 in reply to: Starting the program from the specified address, bootloader #13326
support
KeymasterHi,
Please refer to our bootloader tutorial for a detailed example.
December 21, 2017 at 05:31 in reply to: Problem: Even when the breakpoint hit, it still runs a little. #13321KeymasterHi,
Thanks for reaching out to us, however unfortunately it’s hard to say what is going on based on this screenshot. Please try enabling gdb logging as described here and then check the log for any irregularities. If you are not sure, please submit the log here and we can try to help you diagnose this.
KeymasterHi,
VisualGDB is licensed per seat (computer/user combination). As a special exception we allow installing personal VisualGDB licenses on one extra seat, however this is normally reserved for cases like reinstalling OS, switching computers, etc. You may use this extra seat to install VisualGDB on a second computer, however this would result in some downtime if you would need to reinstall your OS or replace your hard disk.
KeymasterHi,
Sorry, this is not supported directly yet, however we could add a quick workaround that will let you override the debug settings in the .vgdbsettings file (shared between multiple users) by manually editing the .vgdbsettings.user files. We may also support this properly in the next major release, although we cannot promise this definitively yet.
Would you like to try the manual editing workaround?
KeymasterHi,
On ESP32 the printf() output is forwarded to the serial port. Please setup the device terminal as shown in this tutorial (Custom edition or higher) or use an external terminal program (e.g. SmarTTY).
KeymasterHi,
It looks like your technical support has expired. In order to keep on receiving support please renew your license.
December 15, 2017 at 00:40 in reply to: $(IntDir) modifications are not working with VisualGDB generated Makefile #13297KeymasterHi,
This could happen if the $(IntDir) variable did not have a trailing backslash. Please double-check that your settings include it. If this doesn’t help, please try attaching a minimal repro project and we will investigate it.
KeymasterHi,
Yes, we try to update most of the popular BSPs quarterly and mbed is definitely a popular one. If you would like to share some enhancements you made to it for your own use, we will gladly accept them. Simply send us a pull request via Github.
Normally if you start debugging a project that doesn’t include any register definitions, the hardware register window will display instructions on importing the SVD file. You can also use the following code from our Github repo to convert an SVD file to the VisualGDB format directly: https://github.com/sysprogs/BSPTools/blob/master/libraries/BSPGenerationTools/SVDParser.cs
With the CLOCK_SOURCE macro, please don’t use any special escaping in VisualGDB GUI, e.g.:
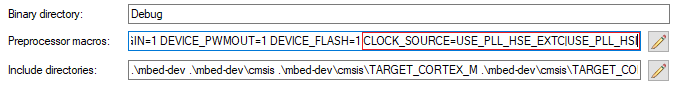
VisualGDB will automatically insert the apostrophes when updating the .mak file:
PREPROCESSOR_MACROS := <...> 'CLOCK_SOURCE=USE_PLL_HSE_EXTC|USE_PLL_HSI'
Attachments:
You must be logged in to view attached files.KeymasterHi,
Thanks for clarifying this. Mbed projects use slightly different ways to specify stack/heap based on the version and the target. Please try locating the linker script for your target (e.g. via VisualGDB Project Properties) and check it for heap-related definitions. It might look similar to this:
    .heap (COPY):
    {
        __end__ = .;
        end = __end__;
        *(.heap*)
        __HeapLimit = .;
    } > SRAM1
In that case please locate the source file that defines symbols in the .heap or .stack sections (if you are not sure, you can find it out via the .map file) and see what affects the size of those symbols (e.g. preprocessor defines). Settings those preprocessor defines should change the amount of memory reserved for stack/heap.
If no source files define any symbols inside .stack/.heap, you can add one manually as shown below:
char __attribute__((section(".stack"))) ReservedForStack[FIXED_STACK_SIZE];
char __attribute__((section(".heap"))) FixedSizeHeap[FIXED_HEAP_SIZE];
This will reserve space for both stack and heap according to the sizes you specify.
KeymasterHi,
Sorry about that. This is a known issue that has been partially fixed in the STM32 BSP 4.5R3. Please update your BSP to that version (and also use the GNU ARM Toolchain) – it should get the correct VFP version to work.
We will address this issue in the next release of our toolchain as well.
KeymasterHi,
The first issue looks like a missing library or a source file. Please try locating a library that defines the “wifi_wps_start” function and add it to your project as described here: http://visualgdb.com/support/linkerinputs/
The second issue looks like you are trying to compile a snippet of a Plain C code in the C++ context. As this is a generic programming question not related to VisualGDB, please consider getting advice at StackOverflow instead. It has an extensive base of answers to common C/C++ issues.
KeymasterHi,
The fatfs module might not be providing hooks to replace the built-in system calls fopen() using the GCC compiler. Please review the sources of the FatFS library and check if it provides its own versions of fopen() and other similar functions that you could call directly.
KeymasterHi,
This looks like one of your CMake configuration files is corrupt. We would advise creating the project from scratch and then adding all source files to it.
KeymasterHi,
OK, we have managed to add the Android support for Advanced CMake Project Subsystem in the upcoming v5.3R8. You can download a preview build with this functionality here: http://sysprogs.com/files/tmp/VisualGDB-5.3.17.1966.msi
A detailed tutorial is available here: https://visualgdb.com/tutorials/android/cmake/
KeymasterHi,
Our ESP8266 toolchain only includes the libraries shipped with the RTOS and non-OS SDKs; if you want to use external libraries, you indeed need to download them (we recommend saving them outside the toolchain directory to avoid losing them during a toolchain update).
-
AuthorPosts