Forum Replies Created
-
AuthorPosts
-
support
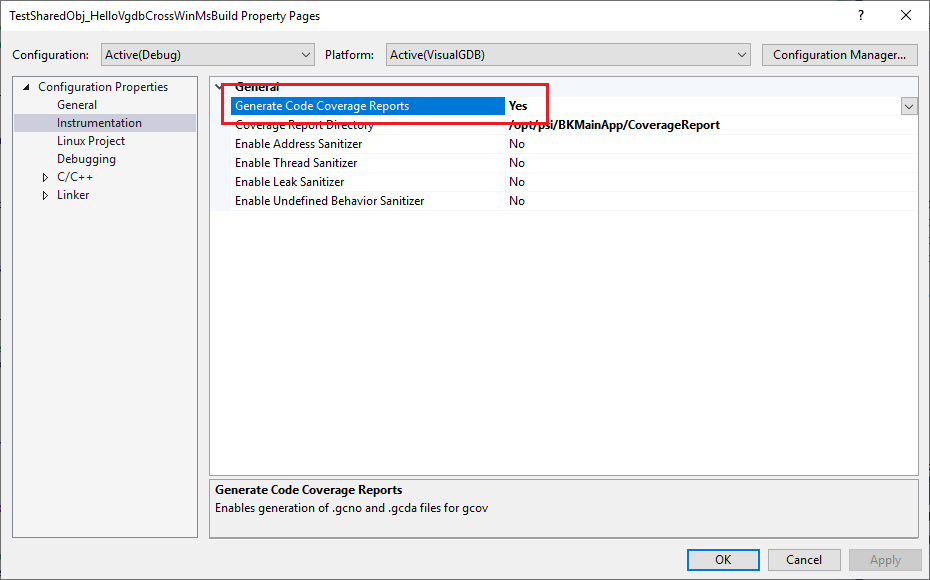
KeymasterThanks for the project files. From a very brief look, it appears you main test project had code coverage disabled on the MSBuild level, so the test container generated by MSBuild (that is essentially a snapshot of MSBuild-level properties necessary for VisualGDB to launch the project outside MSBuild) did not have any coverage-related settings.
After we changed the setting (see below), the container appears OK.
We will run a few more tests on your solution and see if we can improve the usability for this scenario.
Attachments:
You must be logged in to view attached files.KeymasterHi,
Thanks for reporting this. We have added support for detecting busybox and using a different command line in the following build: http://sysprogs.com/files/tmp/VisualGDB-5.4.100.2792.msi
BTW, installing SysprogsSync to the target should be very straight-forward (see this page). It’s just one C++ file, so you can simply build it with the cross-compiler and deploy it to /usr/bin. That will significantly increase synchronization performance compared to file-by-file mode.
KeymasterHi,
Please try setting the VISUALGDB_VERBOSE_OUTPUT and VISUALGDB_SHOW_DIAGNOSTIC_OUTPUT variables to 1 before running VisualGDB. This should produce a much more detailed error message, that should help us pinpoint the root cause (likely one of the XML files being corrupt).
VisualGDB runs unit tests on the hardware by automatically programming the target with OpenOCD (or J-Link depending on the project configuration), reading structured test reports via semihosting and reporting the results to VS. Normally all you need to do is run VisualGDB.exe /runtests <test container file> on a machine/user account where you would be normally able to debug the project (i.e. that has all the necessary packages installed) and VisualGDB will do everything automatically and will generate a report file (see output from running VisualGDB without arguments for a detailed list of the supported switches).
Let us know if you have any further questions and we will be happy to help.
KeymasterGood to know it works.
The ADDITIONAL_MAKE_FILES line in debug.mak and release.mak might get overridden if you edit some of the settings. A safer bet would be to add linux.mak to this variable in the Makefile itself (just before the ADDITIONAL_MAKE_FILES variable gets read).
KeymasterHi,
If you are using MSBuild, please use the regular VS Project Properties (Configuration Properties -> General -> Target Type = Static Library). For Make-based projects, please use the “Makefile Settings” page of VisualGDB Project Properties.
KeymasterThanks, we have received the project. Unfortunately, we could not reproduce any issues – it got loaded correctly immediately:
Please try deleting the ‘VisualGDB’ subdirectory in the solution directory that contains IntelliSense cache (ensure that the CodeDB folder gets deleted), and if it doesn’t help – try opening the project on a different machine, as the problem might be caused by a corrupt VS installation or a conflict with another VS extension. Please also ensure you are using the latest VisualGDB 5.4R2.
Attachments:
You must be logged in to view attached files.KeymasterThe options in the VisualGDB Project Properties (except the J-Link executable path that is shared) are actually defined per project/configuration pair, so it’s safe to use the second setting you mentioned.
Please try using the $(ProjectDir) variable to avoid hardcoding absolute paths.
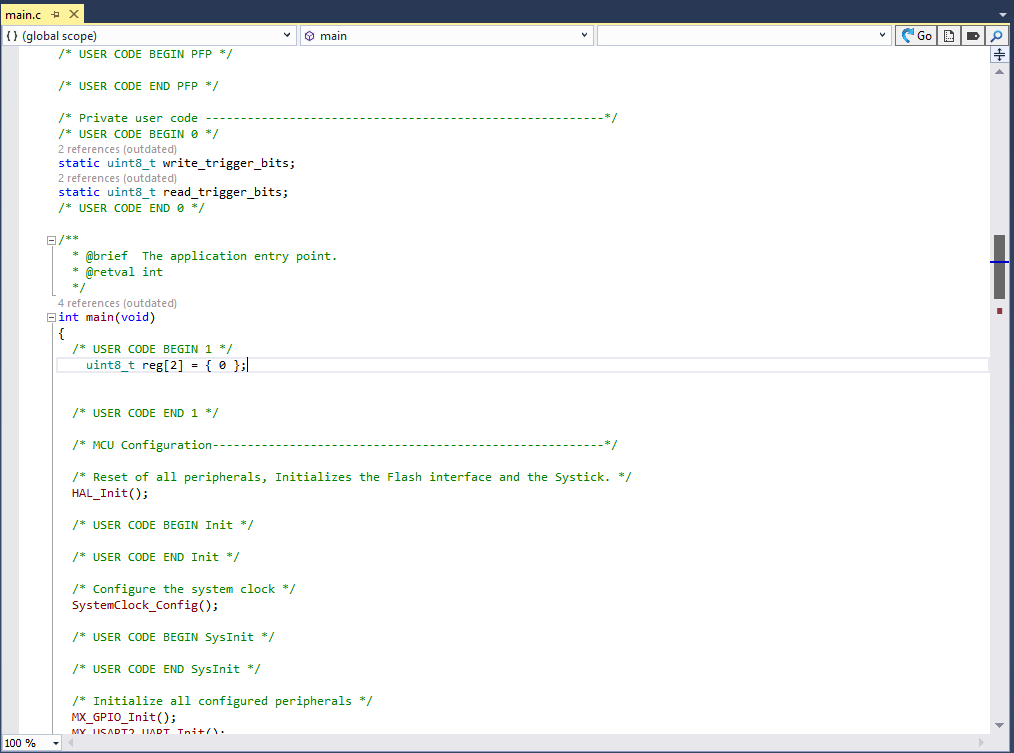
KeymasterThanks for the screenshots and the file, however unfortunately we could not reproduce the problem.
If this is a simple test project anyway, would you be able to send us the entire project (you can use the support form to send the files). If not, please check the Clang IntelliSense Diagnostics Console for error messages or anything suspicious after you save the main source file (and trigger a reparse).
KeymasterThanks for clarifying that you have 2 projects. Most likely the problem is triggered by some combination of settings in those projects (we have previously tried to reproduce it with 1 project only), although it’s hard to pinpoint it from the current screenshots . The test container is missing the <CodeCoverage> element, so that explains why the code coverage it not handled, although this could be triggered by several different options.
Would you be able to reproduce the same problem on 2 freshly created projects, demonstrating the same settings (test frameworks, references between the projects), etc, and attach them here or send them via our support form? This should help us pinpoint and fix this without requesting any more details.
KeymasterHi,
Please try using VisualKernel as shown in this tutorial. It should configure the necessary debug settings automatically.
KeymasterHi,
This is not yet possible, but are planning to release a public SDK with some examples in the next few months. Stay tuned!
KeymasterAccording to our records, your trial has expired, so unfortunately we won’t be able to provide any further support unless you purchase a VisualGDB license. Sorry.
KeymasterPlease let us know the email associated with your VisualGDB order so that we can check your support status and we will be happy to help you.
KeymasterGood to know it works. Since building on Linux is a fairly rare use case (and would require slightly different configuration each time), VisualGDB doesn’t support it out-of-the-box, however it is designed to make it relatively straight-forward. We would advise modifying the Makefile to conditionally include a file called linux.mak that would override CC, CXX and other variables set by debug.mak or release.mak.
Since VisualGDB only edits specific statements inside the Makefile and keeps the general structure, this will only need to be done once.
KeymasterHi,
The difference between different revisions for Raspberry Pi toolchains is mainly the compatible SD card image.
This means that we resynchronize it on our side, verify that the all relevant tool and library versions are still the same (normally, only the gcc, libc, libgcc and libstdc++ versions are critical), run a few tests and release it. I.e. it will work out-of-the-box with the specified SD card image. It may also work with a slightly different image (e.g. no desktop included), but unless we explicitly list it as a “compatible image”, we have not verified it on our side.
-
AuthorPosts