Forum Replies Created
-
AuthorPosts
-
support
KeymasterIn VisualGDB 5.4R2 and earlier, the settings derived from the CPU definition override the settings in the project properties. We have reversed this behavior in the upcoming R3 (you will be able to override the CPU settings via the regular MSBuild pages), however it should not be critical in this case case the STM32 devices do not support the ARM (non-THUMB) instruction set.
KeymasterHi,
The ESP32 debugging is generally less reliable than for ARM devices, so glitches like this one are expected. As it is something caused by the low-level interaction between the ESP32 chip and the Espressif’s port of OpenOCD, please consider asking on the Espressif’s forum. They might be aware of the issue and might be able to suggest some specific workaround.
KeymasterMost likely, building the project with VisualGDB ends up with an incompatible combination of different Arduino components (e.g. core definitions vs. build tool definitions). The easiest way to sort it out would be to delete the existing packages and let VisualGDB re-download the latest ones.
If you decide to untangle it manually, comparing the command lines will likely show differences between the package search directories used by VisualGDB and the Arduino IDE. You can then edit the directories used by VisualGDB via Tools->VisualGDB->Arduino Settings so that they will match the regular Arduino IDE settings.
If anyone else runs into a similar problem, please feel free to post here. If it turns out that the problem is not specific to a single rare setup, we will add checks to VisualGDB to resolve this automatically.
KeymasterNo problem. We have done more experiments with this and it looks like we should be able to generate solution-level test reports with aggregated information from multiple test projects. However, this will involve non-trivial changes to the VisualGDB test engine that might break existing projects, so we will only be able to add this in the next major release (the very rough estimate for a preview build with this feature would be 3-4 months).
KeymasterSorry for the delay. We have updated the VisualGDB logic for generating the test containers on the MSBuild level so that it includes the coverage information from referenced projects.
Please try this build: VisualGDB-5.4.103.2936.msi
Please ensure you enable the test container generation for ALL involved projects (the test project and the referenced libraries):
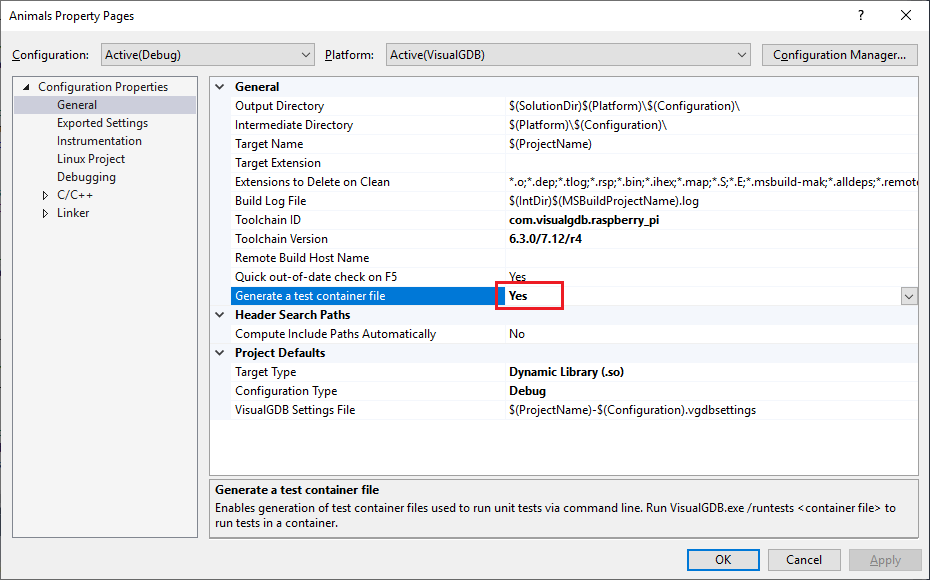
This will get the coverage to work correctly when running the tests from command line (ensure you use the correct test container with the <CodeCoverageInfo> elements when running tests via command line).
Attachments:
You must be logged in to view attached files.KeymasterSorry for the inconvenience. It’s hard to say why the system would end up being unusable; the only explanation we could think about is that some file transfers were not fully completed.
BTW, we are working on an update to VisualKernel that will use our new highly optimized file transfer engine, so it will considerably speed up file and directory transfers when caching kernel symbols.
You can debug the kernel boot if you are using JTAG or VMWare gdb stub by selecting “attach to a crashed/hanging system”. This will bypass any attempts to connect to the target via SSH and will proceed with a low-level connection, even if the kernel has not started yet. Please ensure that you have address space randomization disabled before trying this though as VisualKernel will not be able to detect the load address of the kernel unless it can connect to it via SSH.
KeymasterNo problem, please try this build: VisualGDB-5.4.103.2933.msi
KeymasterPlease try clicking the “Manage cached Linux Kernel Symbols” link in the kernel symbol selector:
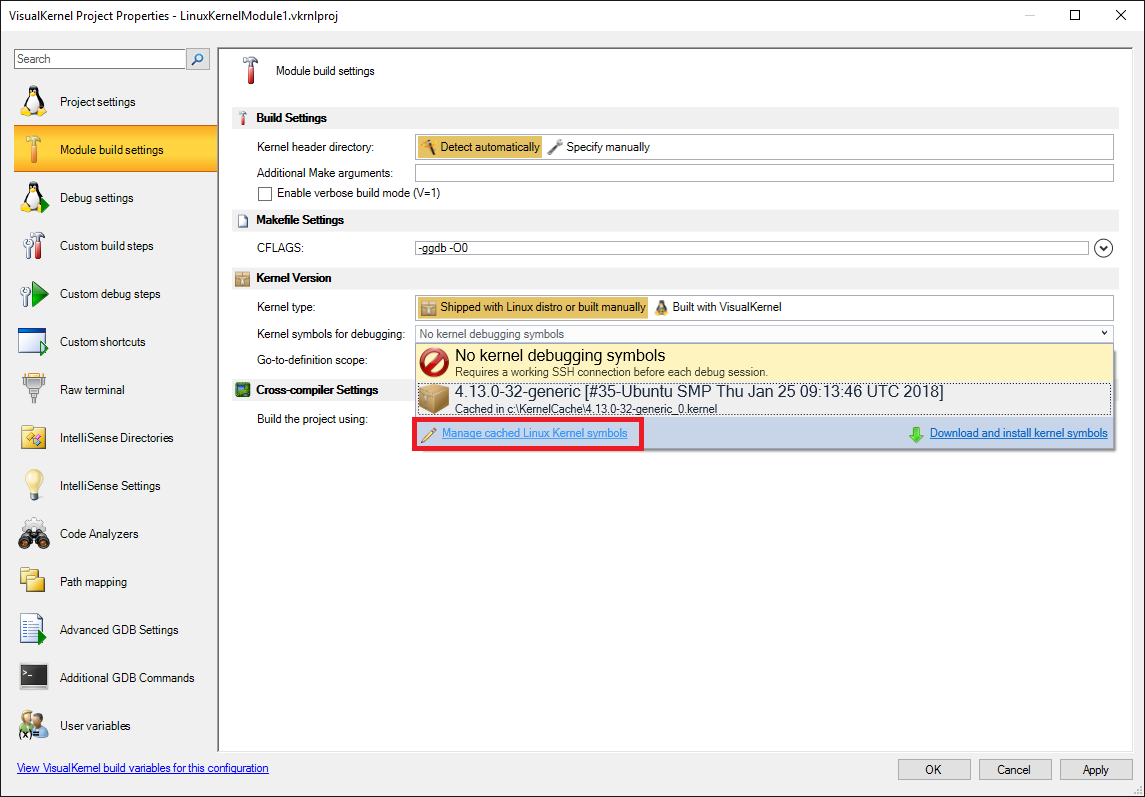
This will show all kernel symbols cached by Visual Kernel for that machine. If they are no longer relevant, please delete them and import another kernel by pressing the “Import symbols/sources” button.
Attachments:
You must be logged in to view attached files.KeymasterThanks for the update. If the problem is not reproduced on Linux, it is likely caused by some specific combination of settings related to your MinGW setup and the only way for us to help you with this would be if you could share your environment as a single ready to use package.
You could also try reinstalling MinGW from scratch, building another copy of boost inside it and checking if that resolves the issues. If the problem is caused by some leftovers from previous experiments in your current environment, creating another one from scratch will fully solve it.
KeymasterThanks for the clarification. We have published a detailed tutorial showing how VisualGDB computes the IntelliSense directories for Advanced CMake projects and how to diagnose various issues related to them: https://visualgdb.com/tutorials/IntelliSense/.
If it doesn’t help, please share your observations (contents of the cache files and the flags reported in Clang IntelliSense Diagnostics Console) and we will help you get it to work.
KeymasterThanks, we have updated the default directories used by VisualGDB to locate Arduino packages. Please try this build: VisualGDB-5.4.103.2931.msi. It also fixes the version comparison, so it should now install the final 2.5.0 package.
If the building still doesn’t work, please try removing all old versions of the ESP8266-related tools (e.g. the entire esp8266 subdirectory in the Arduino packages directory) and let the new build install the latest version.
It also looks like the latest ESP8266 Arduino core (2.5.0) finally fixes the breakpoint issues with the gdb stub, so the debugging experience will now be much better. Please ensure you update the ESP8266 debug package to version 1.2 via VisualGDB Package Manager as the previous one is not compatible with the new Arduino core.
We have also updated our ESP8266 Arduino tutorial to reflect the latest changes.
If you still cannot get the project to build, please try comparing the arduino-builder command lines (used by VisualGDB and Arduino IDE) using Process Monitor and then try running it manually to see which exact difference triggers the issue.
KeymasterHi,
Please carefully review the entire build log. It should normally contain more information about the error before that line. You can scroll the log up using the scroll bar on the right side of the Output window.
KeymasterThanks for clarifying this. If the physical path to the gcc executable remained the same, indeed VisualGDB would keep the old cached values.
Either way, it is recommended to do a full rebuild of your project after changing the gcc executable to ensure that the object files produced by the old and the new toolchains won’t get mixed and this process will also clear out the VisualGDB cache.
February 27, 2019 at 17:43 in reply to: Missing source files when setting breakpoints for debugging #24016KeymasterGood to know it works. If you encounter further issues, don’t hesitate to create another topic and we will be happy to help.
KeymasterNo worries. For CMake projects the implicit toolchain directories are indeed cached in the VisualGDBCache directory, although they should get invalidated when the gcc executable changed. The only exception would be if you changed gcc via your own CMake scripts (not maintained by VisualGDB), but kept the old toolchain in the VisualGDB settings.
-
AuthorPosts