Forum Replies Created
-
AuthorPosts
-
support
KeymasterHi,
No problem, please find the detailed explanation of the related settings below:
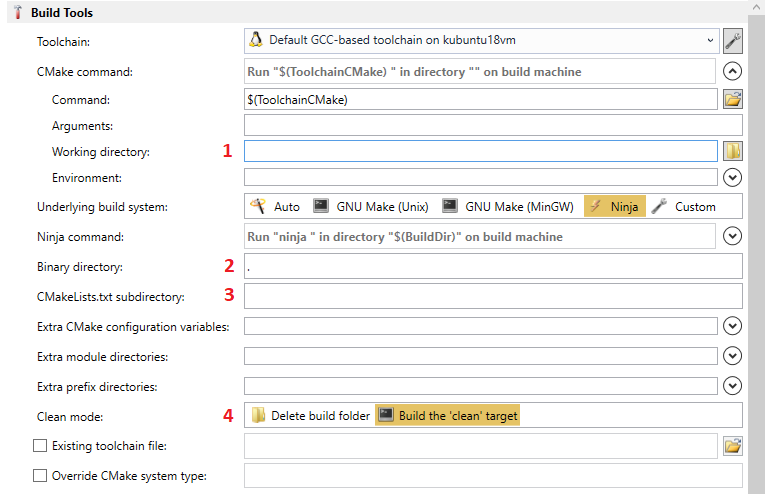
- Working directory is the directory where VisualGDB will physically launch cmake.exe. It defaults to the remote source directory and does not have effect when using cmake in the server mode (i.e. with the Advanced CMake Project Subsystem).
- Binary directory is the relative path to the directory where CMake will create the binaries.
- CMakeLists.txt subdirectory is the relative path to the directory where CMake will search for the top-level CMakeLists.txt.
- This setting controls how VisualGDB will clean the projects. The default setting is to delete the entire binary directory (if you are using direct SSH access and the build directory is the same as the source directory, the latest VisualGDB 5.4R5 will skip the deletion and will suggest changing this setting). For the setup you described, we would advise using the “build the ‘clean’ target” option.
The CMake command line equivalent to the VisualGDB settings mentioned above would be:
cd <working directory> && cmake <CMakeLists.txt subdirectory> -B<binary directory>
We have also double-checked the latest v5.4R5 build and it looks like the “clean mode” setting may not always be shown correctly. We have fixed it in this build: VisualGDB-5.4.105.3138.msi
Attachments:
You must be logged in to view attached files.KeymasterHi,
Based on our understanding, Espressif is not actively developing the NonOS SDK and is instead focusing on the RTOS SDK 3.x that is based on the ESP-IDF framework.
We have recently added full support for the latest RTOS SDK to VisualGDB and would like to encourage our users to switch to it, as it seems to be more regularly maintained than the old NonOS SDK.
Unless Espressif releases another major version of the NonOS SDK that will work sufficiently reliably, we will not be supporting it officially, sorry. That said, please feel free to use our open-source BSP generator to build a BSP based on the patched SDK you have, so you won’t need to mix different versions manually.
KeymasterUnfortunately as you haven’t shared the VisualGDB build number that is usually shown above the stack trace, it’s impossible for us to decode it and locate the exact cause for it.
Generally, as the trace mentions custom debug steps, please try removing them from the .vgdbsettings file and see if the problem persists. If not, please try narrowing it down to a specific debug step that will likely contain an excessively long path. You can also try using View->Other Windows->VisualGDB Diagnostics Console to get a detailed log of the actions performed by VisualGDB.
The second issue looks like you are using a $(ProjectDir) variable in a context where it is not supported (e.g. Quick Debug). Please try searching your .quickdbg file for $(ProjectDir) and edit it to remove the unsupported variable reference. If you are not sure about the exact reference, please try creating a new quick debug preset from scratch, verify that it works and then compare the working and non-working preset.
KeymasterThanks for suggesting this. The boards do look promising and we will consider supporting them out-of-the-box once they get more traction (i.e. major distributors like DigiKey begin carrying them and/or we see more media coverage for them indicating the growing amount of users).
Until the boards are fully supported, you should be able to configure VisualGDB to target them manually by using our RISC-V toolchain and then specifying the build flags manually as shown in this tutorial. We will be happy to help you locate the relevant VisualGDB settings to make this work, however please be advised that as the SDK and the board is relatively new, it may not work as reliably as ARM-based devices.
Edit: VisualGDB now supports K210 boards directly. You can find more details in this tutorial: https://visualgdb.com/tutorials/risc-v/kendryte/k210/
KeymasterThanks for playing fair. Do do appreciate it as it takes considerable effort on our side to provide a maintained and supported product.
The problem you are experiencing is most likely caused by the Keil trying to compile a C++ file as an assembly file, or vice versa. In order to diagnose it, please follow the steps below:
- Try narrowing down the problem to a specific source file. Check the build output (View->Output) to see what files are built just before the problem triggers. Then try building that specific file by opening it in Visual Studio and pressing Ctrl-F7 (or right-clicking in Solution Explorer and selecting “build”).
- Once you can reproduce the problem with a specific file, please check its type and input language via File Properties. If you are not sure, please let us know the file extension, the values of Configuration Properties -> Item Type and Configuration Properties -> C/C++ -> Advanced -> Compile As, and also the exact build output.
We have tried reproducing the issue with VS2019, however could not get the behavior you described. Based on the screenshot, it looks like VisualGDB is trying to save the solution before creating the project and Visual Studio fails to complete the save. Please try updating VS2019 to the latest version and also check if the problem can be reproduced when creating a new GCC-based project from scratch. If not, please try comparing the working and non-working setups to narrow down a specific setting that triggers the issue, so that we could add a workaround on our side.
April 25, 2019 at 03:10 in reply to: Error message when trying to create new folder via Solution Explorer #24766KeymasterThanks for confirming the issue on the latest version. We have followed the steps you described and were able to reproduce and fix the problem. Please try this build: VisualGDB-5.4.105.3135.msi
KeymasterHi,
Unfortunately this would be not that easy due to the differences between the VC++-based projects and projects fully controlled by VisualGDB (e.g. ESP-IDF). That said, we are planning to add support for embedded projects to the Advanced CMake Project Subsystem in the next major VisualGDB release, so we should be able to add this command there.
KeymasterThanks for the log files. We have looked through them (the links to Google Drive were OK), however unfortunately there is no obvious indication of the problem there. Generally, as the OpenOCD’s STM32L0 driver is not maintained by us, it’s hard to suggest a definitive way of fixing this.
That said, please consider one of the following workarounds:
- Try using Segger J-Link instead of OpenOCD. Segger maintains their own fully supported replacement for OpenOCD that is specifically focused on out-of-the-box support for most of the devices on the market, so it should not share any of the OpenOCD bugs.
- Alternatively, please try building our OpenOCD fork from sources (see this tutorial for detailed steps) and try stepping through the relevant FLASH loader code. If you could pinpoint a specific cause for this, we will be happy to include a fix in our fork as long as it doesn’t break the backward compatibility.
- If you can reliably reproduce the problem, please consider filing a bug report via the OpenOCD mailing list. The maintainer of the STM32L0 driver might be able to pinpoint the problem and fix it based on the logs you have collected. If the fix is included in the regular OpenOCD repository, we should be able to pick it up and include in our builds promptly.
KeymasterHi,
No problem, please try this build: VisualGDB-5.4.105.3134.msi
We have added a context menu command for ESP-IDF projects to open the raw terminal (please note that the raw terminal is only supported on the Custom edition and higher, so the command won’t appear for the Embedded and Linux editions of VisualGDB).
KeymasterThanks for sharing this, it does look like the potential cause for the problem, although unfortunately it’s not something that VisualGDB could easily fix.
KeymasterSorry, it looks like something related to the wiring or layout of a specific board and is generally outside VisualGDB’s control. The only way to diagnose this that we could suggest would be to try understanding the differences between a working an a non-working setup (e.g. using a logic analyzer). Please also consider asking on the Espressif forums – you may get some insights into this from the team that designed the WROVER/WROOM boards.
April 24, 2019 at 16:09 in reply to: Error message when trying to create new folder via Solution Explorer #24739KeymasterHi,
Please try updating to the latest VisualGDB 5.4R5. It includes multiple ESP-IDF-related updates and might fix this issue. If it doesn’t help, please let us know the updated stack trace and we will investigate this.
KeymasterAccording to our records, it looks like your trial period has expired. In order to get further technical support, please consider purchasing a license.
Please note that installing VisualGDB on another PC, editing registry to affect the trial counter, or creating further forum accounts does not reset your trial period from the support point of view.
As providing quality technical support for our users requires continuous effort on our side, we do expect our users to play fair and are not able to offer any help once the original trial period expires.KeymasterHi,
It looks like your ESP8266 Arduino core might be corrupt. The easiest way to fix this would be to delete it and let VisualGDB automatically download the latest version of the core and all related tools.
KeymasterHi,
It looks like a missing reset signal (in our experiments, some probes had to use the TRST signal, while others needed SRST), so trying a few reset options in OpenOCD configuration script might resolve this. If not, please try using Olimex ARM-USB-OCD-H (we have fully tested it on our side and covered in our tutorials), or some of the ESP32 boards with on-board JTAG, that should have the necessary wiring and matching configuration scripts.
-
AuthorPosts