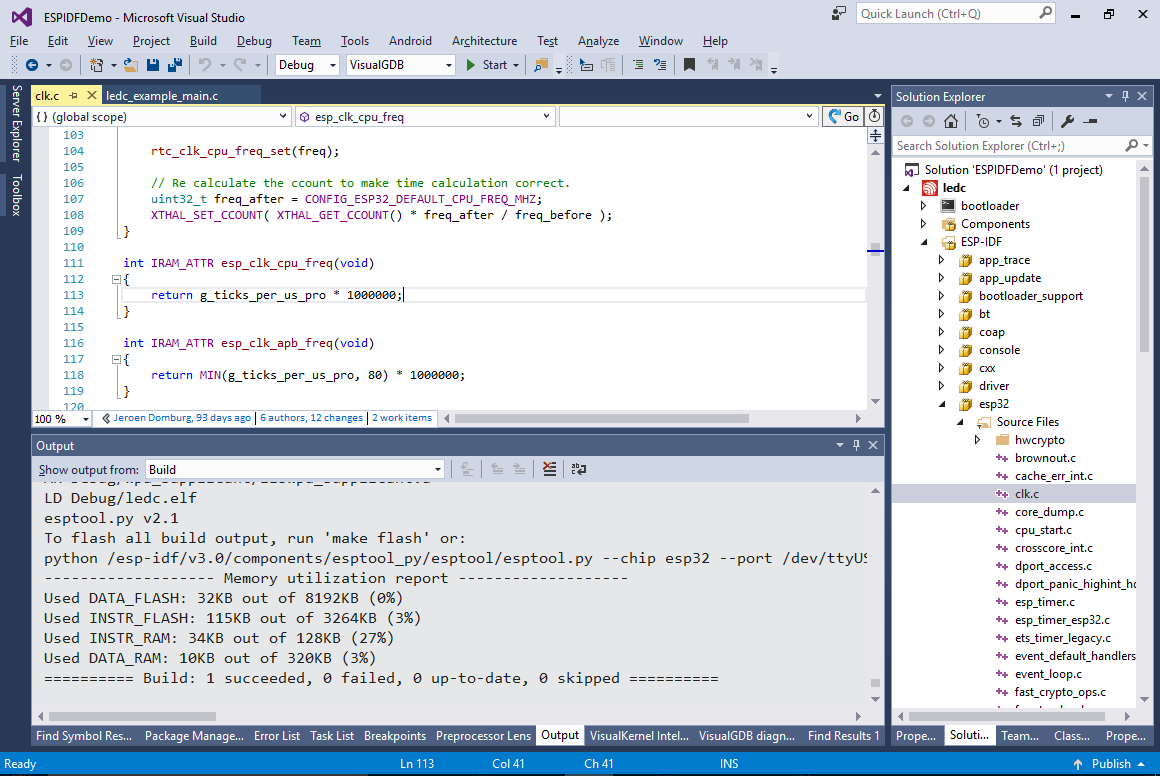
Today we are proud to release VisualGDB 5.4 Preview 6 introducing support to the new CMake-based version of the Espressif’s ESP-IDF framework and out-of-the-box compatibility with the MSYS2-based toolchain. The CMake-based ESP-IDF projects, powered by the Ninja build system, build much faster than the regular Make-based projects and offer a higher degree of customization in the Solution Explorer: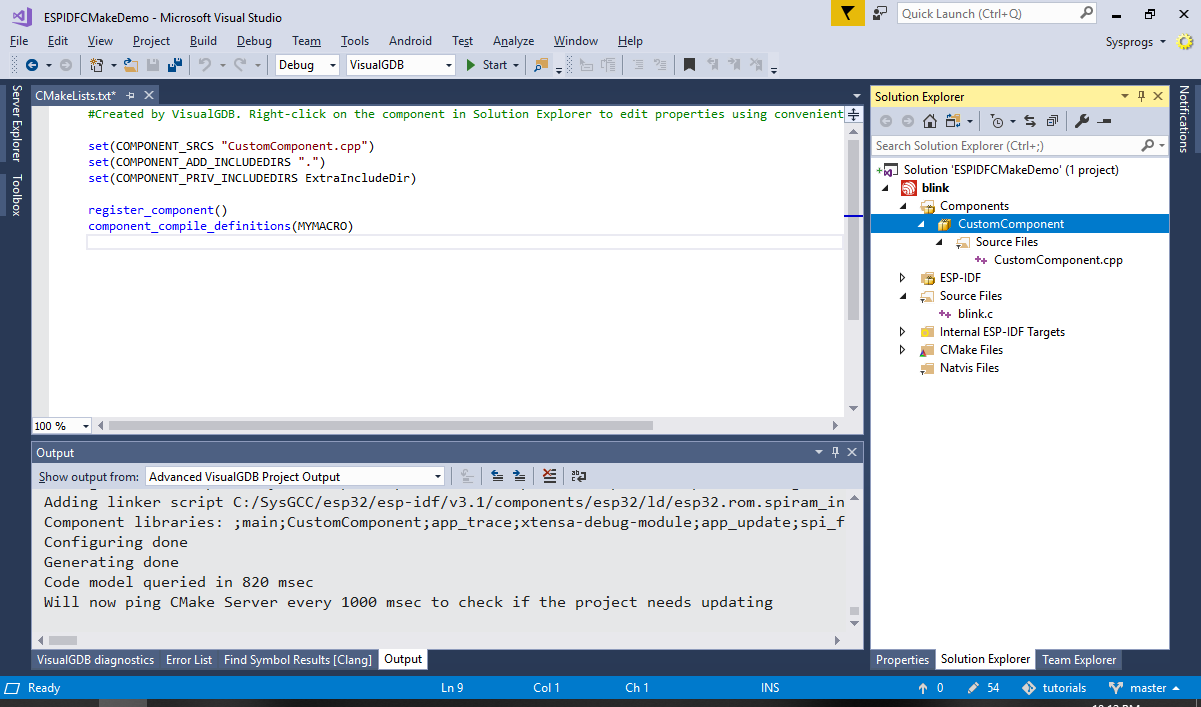
Continue reading Introducing CMake support for ESP-IDF Projects