VisualGDB has a history of supporting embedded devices that has gone through several steps of evolution. The very first VisualGDB version released 5 years ago expected you to know the gdb and OpenOCD command lines, one of the next versions provided convenient GUI for locating OpenOCD scripts and settings that eventually morphed into detecting the settings for common devices and debug adapters, still requiring to go into script editing to support choosing a specific ST-Link instance or turning on the “Connect under reset”.
VisualGDB 5.3 Preview 5 replaces this experience with a much more streamlined (and powerful) UI and I will show you its main highlights in this post.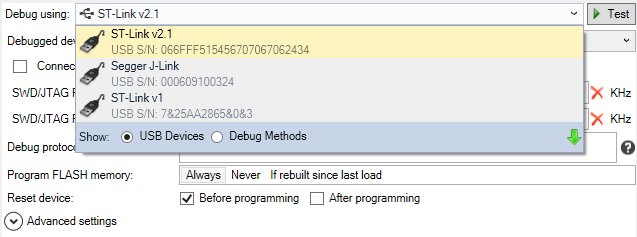
Device View
The previous versions of VisualGDB relied on some basic knowledge about the underlying debug tools. Depending on the type of your debug adapter you had to choose between Segger J-Link software, OpenOCD or the GDB stub for ESP8266 devices. VisualGDB 5.3 Preview 5 abstracts this out. Simply plug in your USB debugger and VisualGDB will display it in the “USB Devices” view. Select it and VisualGDB will automatically pick the best underlying debug method to use with your device. If multiple debug methods can work on the same device, VisualGDB will let you pick one: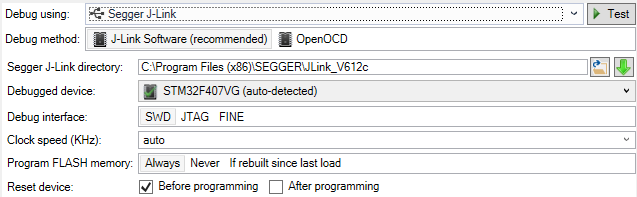
If you have connected more than one debug adapter of the same type (e.g. several ST boards with on-board ST-Links), VisualGDB will let you pick a specific instance, remember its serial number and automatically pass it to OpenOCD or Segger software so you won’t need to edit any settings manually.
Advanced Settings
For advanced users that want to customize the OpenOCD (or Segger Software) command lines and startup commands, we added a special advanced view. Simply expand it and you’ll be able to edit the command line and the corresponding GDB startup commands used by VisualGDB: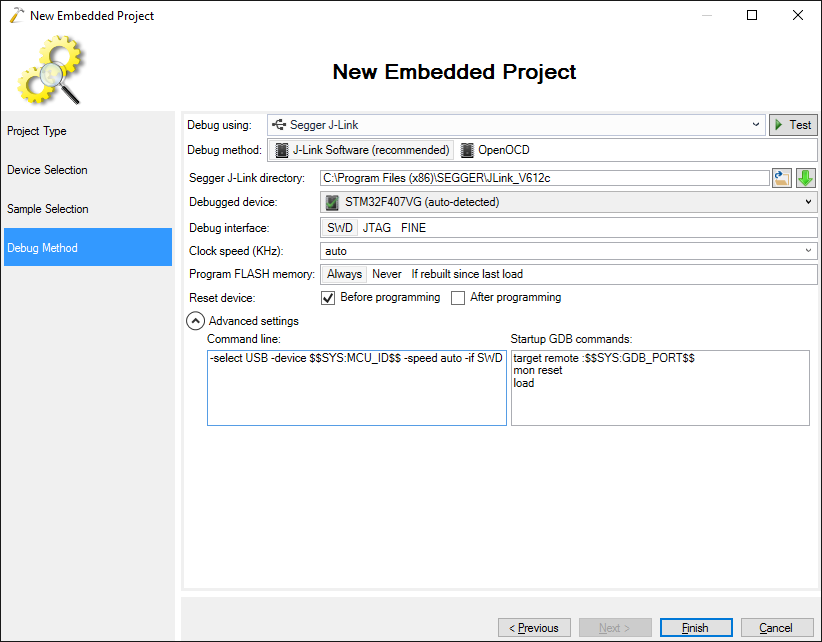
You can use it to insert custom FLASH initialization code, load custom data sections, setup clocks and more. The advanced settings are linked with the basic settings configurable via the GUI, so you won’t lose any of your custom settings when editing common parameters via GUI.
New OpenOCD Experience
We have completely redesigned the settings page for OpenOCD with usability in mind. If you want to try a rare unsupported device or debug adapter, you no longer need to switch to the custom view losing the simplicity of the basic view. Simply enable the “Show raw OpenOCD scripts” checkbox and you can choose raw script files additionally to known devices and programming adapters: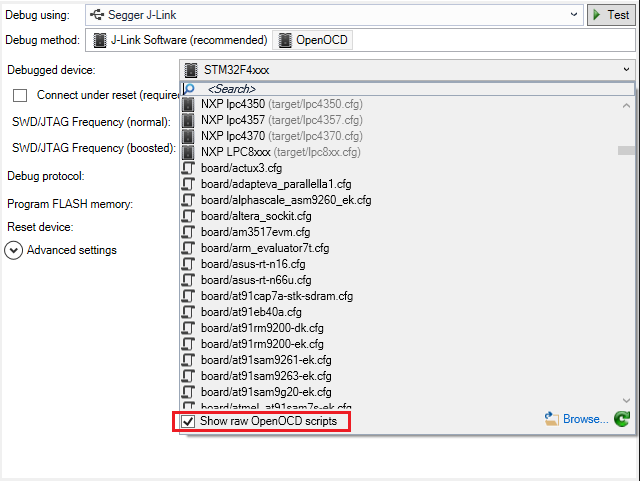
We have also made it extremely easy to edit common settings hardcoded in OpenOCD scripts. You can now change the ST-Link frequency and enable the “connect under reset” mode via the GUI instead of locating and editing the OpenOCD scripts manually: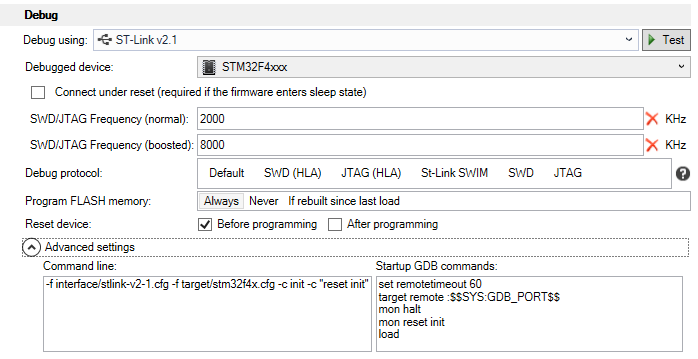
VisualGDB will automatically create a temporary script with the necessary edits for you.
Better Error Handling
The new Device View makes VisualGDB aware of the exact USB programmer instance used with the project, so it can check and fix more common errors. If you start debugging your project on a different machine with multiple ST-Links attached to it, instead of letting OpenOCD produce a cryptic error message, VisualGDB will simply let you choose the instance you want to use: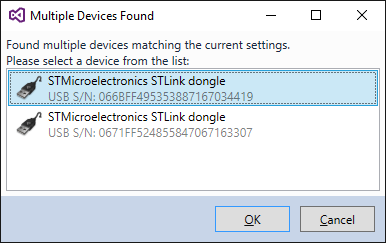 VisualGDB will now check for missing USB drivers each time you start debugging your project, so you won’t need to go to the debug settings and check the drivers manually:
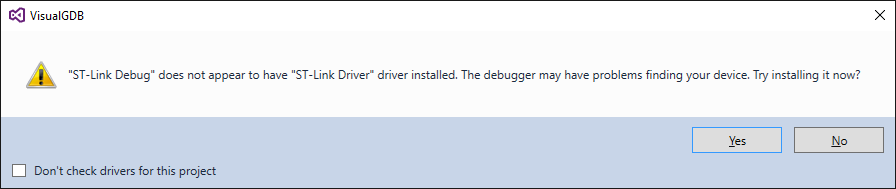
For errors that could not be automatically diagnosed, VisualGDB will try to automatically extract the error text from the OpenOCD/J-Link log and will let you quickly view the entire log with one click of a mouse: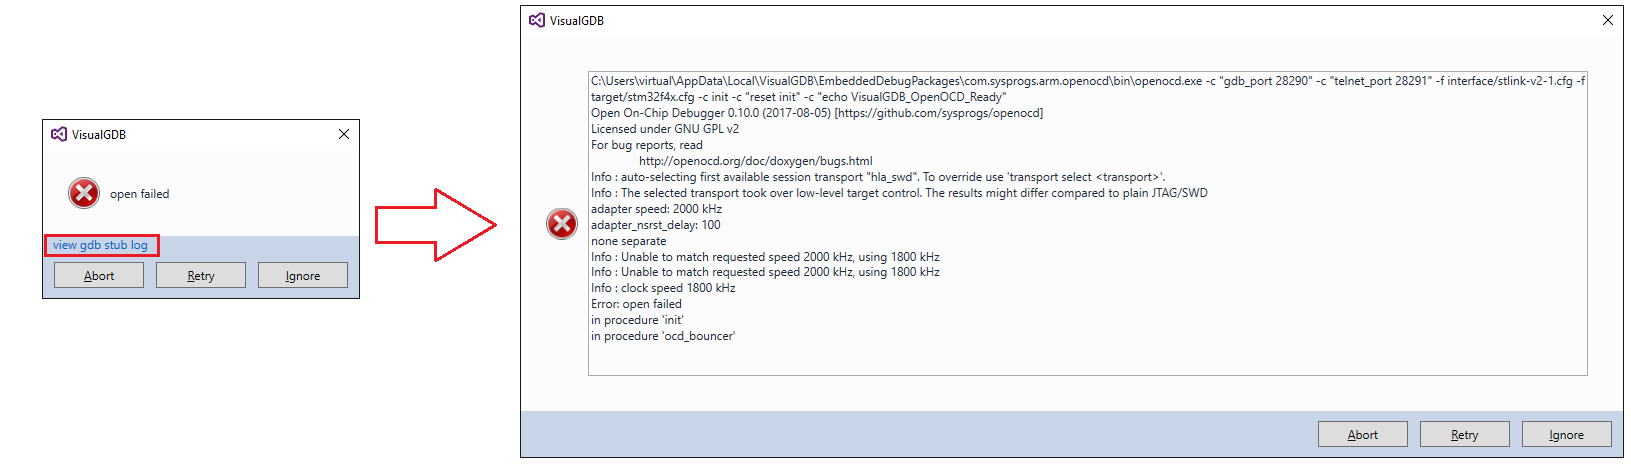
We have also extended the automatic connection testing to all major debug methods and made it more comprehensive. Instead of just checking that the OpenOCD output looks right, VisualGDB will actually try connecting to it and reading the device registers, letting you catch common configuration errors easier straight from the settings window:
Improved ESP8266/ESP32 Debugging
We have also released updates to our ESP8266 and ESP32 toolchains that use the new debug method system. Aside from being able to add custom startup commands, we have added a convenient interface for including embedded resources (binary files programmed a fixed addresses in FLASH). Simply use the new GUI and VisualGDB will program the extra files automatically: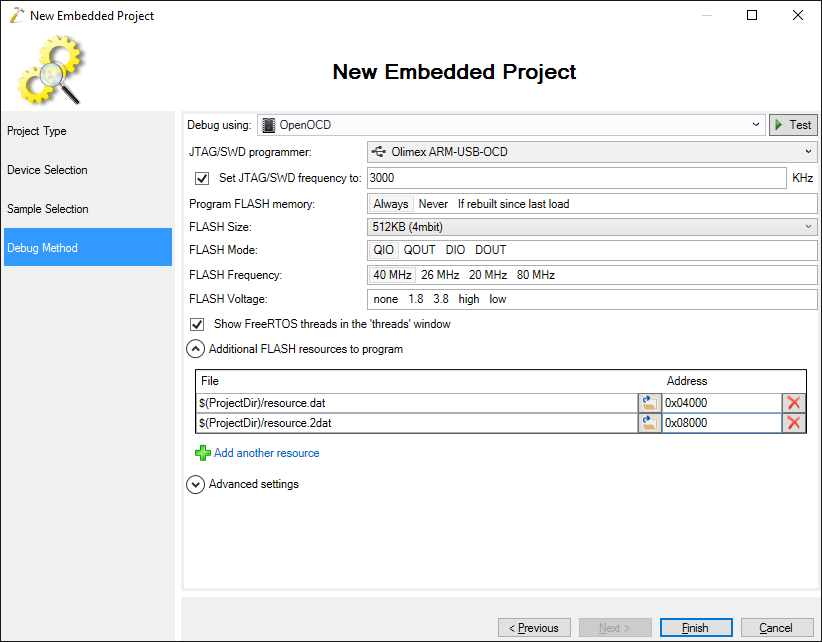
Backward Compatibility
Once you convert your project to the new VisualGDB 5.3 Preview 5 format, opening it with the previous VisualGDB versions would require re-entering debug settings. The rest of the settings are backward compatible. If you prefer the old debug method-based view, you can always switch back to it by selecting “Show: Debug Methods”: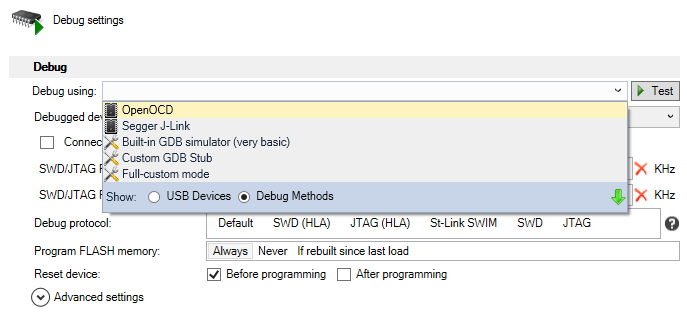
VisualGDB will remember the last used mode and automatically choose it when creating new projects.
Try it Out
You can download VisualGDB 5.3 Preview 5 from the download page. Don’t forget to update your debug packages and toolchains via Tools->VisualGDB->Manage VisualGDB Packages. Give it a shot and never hesitate to submit feedback via the forums or support form.