In the recent years CMake has become the de-facto standard build system for many C/C++ projects due to its flexibility, reliability and great build speed. We responded to it by designing the VisualGDB’s Advanced CMake Project Subsystem – a replacement for the regular Visual Studio project mechanism that treats the CMakeLists.txt files as Visual Studio projects and automatically edits them once you edit your target properties in Solution Explorer. But today we are announcing a mechanism that will make your CMake experience dramatically better – the CMake Script Debugger:
 A Quick Walk Through
Debugging your CMake scripts with VisualGDB is easy – simply right-click on your Advanced CMake project in Solution Explorer and select “Launch CMake Debugger”: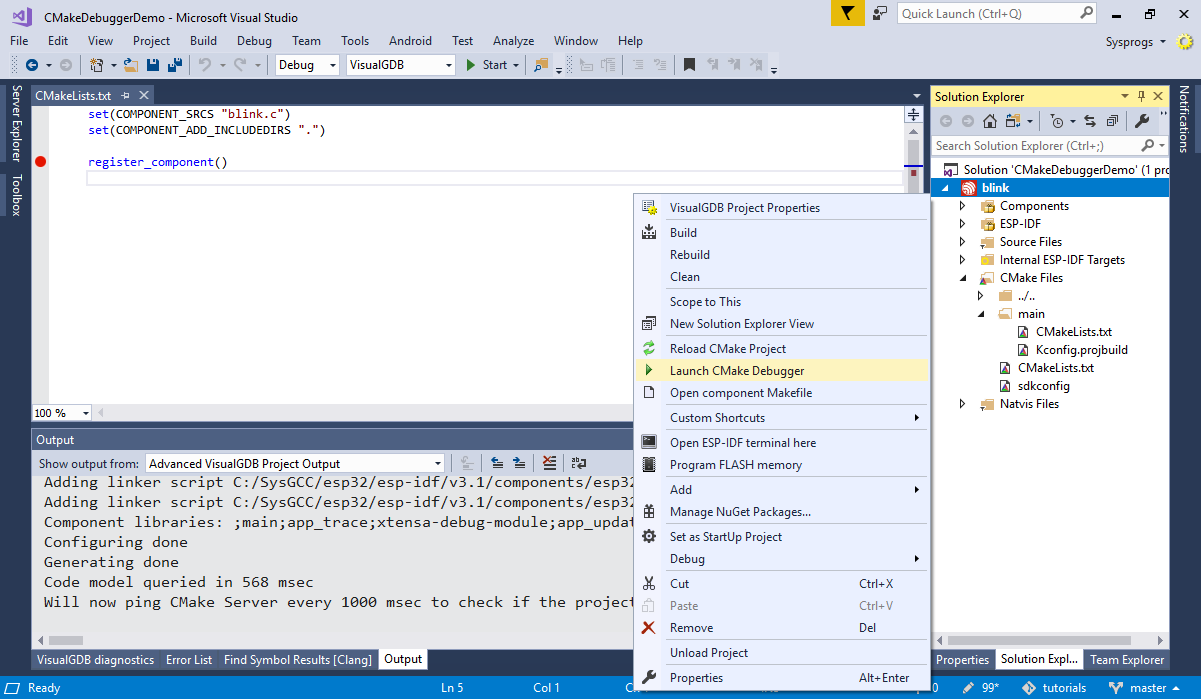
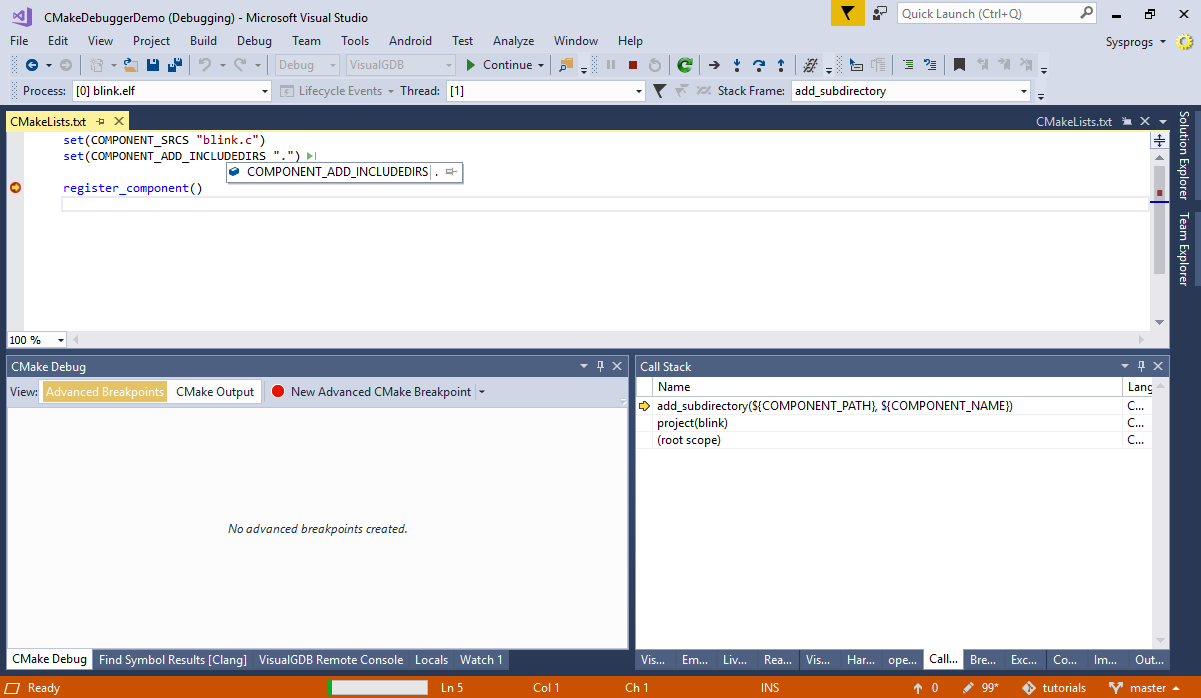
VisualGDB will launch the CMake configuration process and will stop at the first line executed by CMake. Debugging CMake scripts won’t be much different from debugging regular applications – you can set breakpoints in CMakeLists.txt files (or use function names) and step in, over and out of CMake statements, see the call stack and evaluate variables. You can also change the variable values in-place and use the “Set next statement” command to skip over a faulty line, or re-evaluate a recently failed one:
Advanced Breakpoints
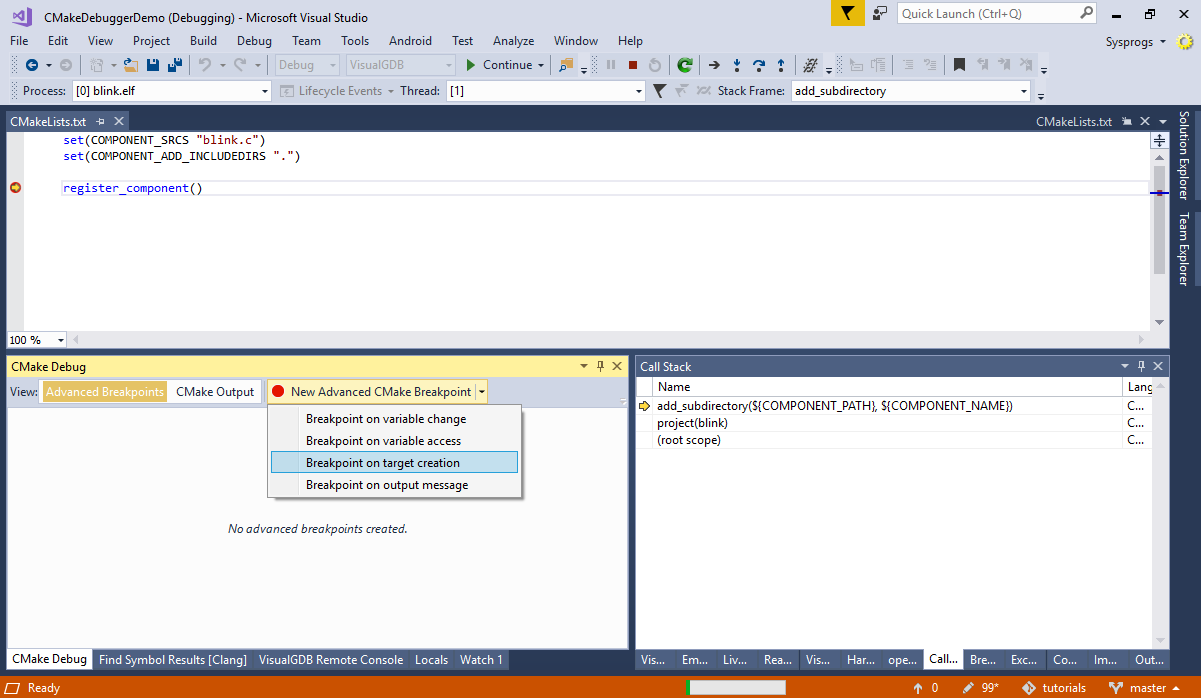
To make it easier finding the relevant parts of your scripts, we have added a few special CMake-specific breakpoint types:
- When a certain variable is modified or accessed
- When a specific target (or any target) is created
- When CMake produces an output line containing the specified substring
 So if you want to understand the context in which a certain target was created, or trying to track down a cryptic error message, you don’t need to look through all of your CMake scripts – just set one of those advanced breakpoints and VisualGDB will find it for you:
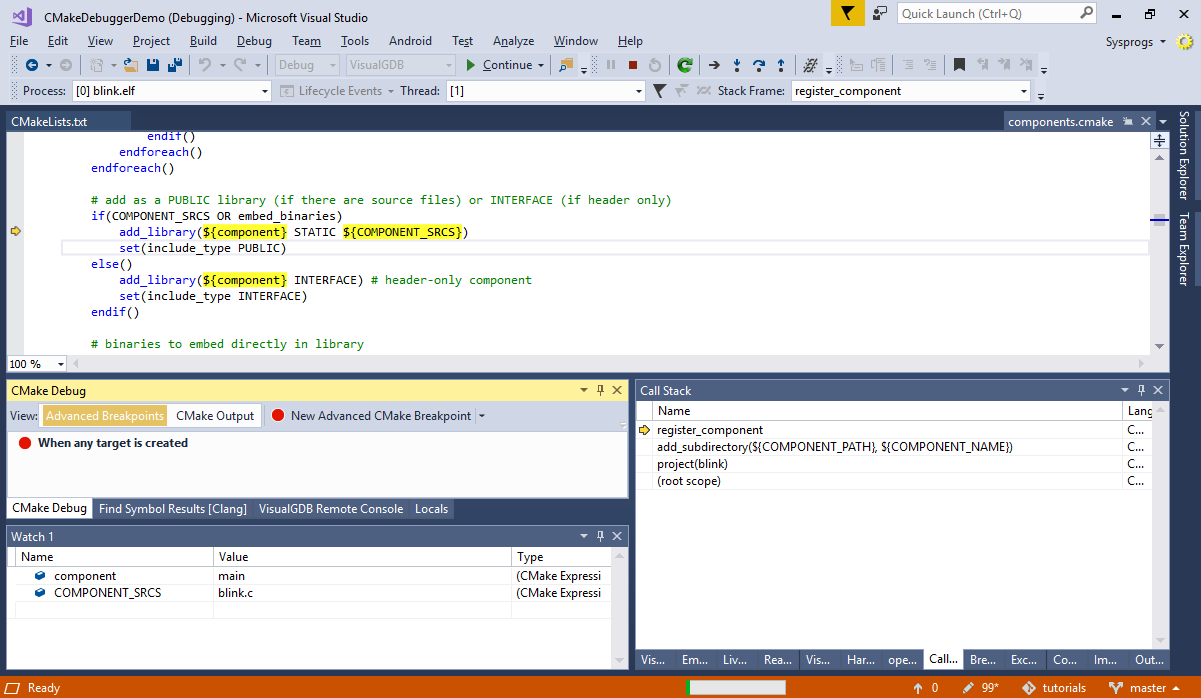
Quick Debug
If you are not using the Advanced CMake Project Subsystem (or not using VisualGDB yet), you can still try out the new CMake Debugger. Simply run the Debug->Quick Debug CMake Scripts command, specify the path to the CMake executable and your working directory and VisualGDB will automatically run the CMake debugger: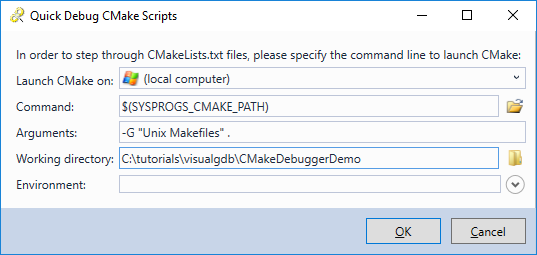
Note that this option is only available in the Custom edition and higher (including the trial).
Under the Hood
The CMake script debugger is made possible through our open-source CMake fork. It utilizes efficient algorithms to handle breakpoints and accurately report the internal script state to VisualGDB, resulting in high performance when running CMake either on the Windows machine or via SSH. VisualGDB will automatically install the Windows build of our CMake fork when you start debugging your first project. If you are running CMake remotely, we provide detailed instructions on building our CMake fork on your Linux system.
Try it out
You can download VisualGDB 5.4 Preview 7 on the download page. If you have any feedback, don’t hesitate to use our support form or the VisualGDB forum.