Forum Replies Created
-
AuthorPosts
-
Timo Engelmann
ParticipantHi SysProgs,
7 years later – is the answer still the same?
Some collegues working with macOS and after Microsoft has discontinued Visual Studio for macOS in August 024, we are looking for a way to use VSCode.Best regards Timo
ParticipantThe following line gives a hint:
This warning is for project developers. Use -Wno-dev to suppress it.But where should it be set?
ParticipantHi,
In the meantime, we updated to VisualGDB beta 6.0.4 and tried this fix. Now the
<returns>part will be displayed in IntelliSense.
However, there are some further issues if display the comment via IntelliSense::- Long content is not fully displayed. If the comment is longer than approximately 18 lines, the additional lines are not displayed via IntelliSense.
– intellisense_comment_01.png => Method comment block.
– intellisense_comment_02.png => Result if mouse hover. => the last lines are not displayed.
The only solution is to delete the last letter of the method name and type it again.
Then another dialog is displayed: intellisense_comment_03.png - Too much space between the comment content and the ‘Returns’ part. Between the blocks, there are normally no empty line spaces. But the ‘returns’ section begins with three empty lines.
- Inconsistency in handling of a new line. A
</param>,end tag at the beginning of a new line creates a space between the ending block and the next. This is good. The</summary>does not do this.
Can you check this?
It would be nice if this issus are fixed at the next beta.Best wishes,
TimoAttachments:
You must be logged in to view attached files.ParticipantThanks for the response. I will try the workaround.
Participant<p style=”text-align: left;”>Hi,
is there an update regarding the C++20 support of Intellisense?
I use
– VisualGDB 5.6R9 build 4777
– STM32 CMake Project with ARM toolchain GCC 12.2.1 / GDB 12.2I need the C++20 standard. The project compiles without issues.
But with C++20 the Intellisense don’t work.
In Error List window following ist shown:Severity Code Description Project File Line Suppression State
Error [Clang IntelliSense] Error: invalid value ‘gnu++20’ in ‘-std=gnu++20’ 1After setting back to C++17, the Intellisense is working.
How can I solve the issue?
Best regards,
Timo</p>
ParticipantPerfect!
Thanks for this good explanation!
I should learn a little more about CMake 🙂ParticipantOne additional info:
It seems that it is sufficient if the string “Debug” is included in the configuration name.Participant6. Add “Optimized for GDB (-ggdb)” option
See attached image 08.jpg7. Build again and start Debugging
Build was successful and now only the breakpoint in “main.cpp” (my own file) is available. The Breakpoint in “system_stm32g4xx.c” is still not available.
See attached image: 09.jpg8. #error “Test” added in “system_stm32g4xx.c”
Output:Run "C:\PROGRA~2\Sysprogs\VISUAL~1/ninja.exe " in directory "C:\_Dev\Projects\eti2si\Repos\EmptyCubeMxPrj\VisualGdbEmptyCubeMxPrj\VisualGdbEmptyCubeMxPrj/build/VisualGDB/Renamed" on local computer
C:\PROGRA~2\Sysprogs\VISUAL~1/ninja.exe
[1/3] Building C object CMakeFiles/BSP.dir/Core/Src/system_stm32g4xx.c.obj
FAILED: CMakeFiles/BSP.dir/Core/Src/system_stm32g4xx.c.obj
c:\sysgcc\arm-eabi\bin\arm-none-eabi-gcc.exe -DSTM32G474xx -DUSE_HAL_DRIVER -I../../../Core/Inc -I../../../Drivers/STM32G4xx_HAL_Driver/Inc -I../../../Drivers/STM32G4xx_HAL_Driver/Inc/Legacy -I../../../Drivers/CMSIS/Device/ST/STM32G4xx/Include -I../../../Drivers/CMSIS/Include -ffunction-sections -fdata-sections -mcpu=cortex-m4 -mfpu=fpv4-sp-d16 -mhard-float -MD -MT CMakeFiles/BSP.dir/Core/Src/system_stm32g4xx.c.obj -MF CMakeFiles\BSP.dir\Core\Src\system_stm32g4xx.c.obj.d -o CMakeFiles/BSP.dir/Core/Src/system_stm32g4xx.c.obj -c ../../../Core/Src/system_stm32g4xx.c
../../../Core/Src/system_stm32g4xx.c: In function 'SystemInit':
../../../Core/Src/system_stm32g4xx.c:181:2: error: #error "Test"
181 | #error "Test"
| ^~~~~
ninja: build stopped: subcommand failed.No -ggdb option is set.
9. #error “Test” added in my “main.cpp”
Output:Run "C:\PROGRA~2\Sysprogs\VISUAL~1/ninja.exe " in directory "C:\_Dev\Projects\eti2si\Repos\EmptyCubeMxPrj\VisualGdbEmptyCubeMxPrj\VisualGdbEmptyCubeMxPrj/build/VisualGDB/Renamed" on local computer
C:\PROGRA~2\Sysprogs\VISUAL~1/ninja.exe
[1/4] Building CXX object CMakeFiles/VisualGdbEmptyCubeMxPrj.dir/main.cpp.obj
FAILED: CMakeFiles/VisualGdbEmptyCubeMxPrj.dir/main.cpp.obj
c:\sysgcc\arm-eabi\bin\arm-none-eabi-g++.exe -DSTM32G474xx -DUSE_HAL_DRIVER -I../../../Core/Inc -I../../../Drivers/STM32G4xx_HAL_Driver/Inc -I../../../Drivers/STM32G4xx_HAL_Driver/Inc/Legacy -I../../../Drivers/CMSIS/Device/ST/STM32G4xx/Include -I../../../Drivers/CMSIS/Include -ggdb -fno-exceptions -fno-rtti -ffunction-sections -fdata-sections -mcpu=cortex-m4 -mfpu=fpv4-sp-d16 -mhard-float -MD -MT CMakeFiles/VisualGdbEmptyCubeMxPrj.dir/main.cpp.obj -MF CMakeFiles\VisualGdbEmptyCubeMxPrj.dir\main.cpp.obj.d -o CMakeFiles/VisualGdbEmptyCubeMxPrj.dir/main.cpp.obj -c ../../../main.cpp
../../../main.cpp:93:2: error: #error "Test"
93 | #error "Test"
| ^~~~~
[2/4] Building C object CMakeFiles/BSP.dir/Core/Src/system_stm32g4xx.c.obj
ninja: build stopped: subcommand failed.Here the -ggdb option is set.
10. Renamed the configuration from “Renamed” back to “Debug”
Build was successful and both breakpoints are working. (Hint: the #error lines are removed before build.)After adding both #error “Test” lines again following output:
Run "C:\PROGRA~2\Sysprogs\VISUAL~1/ninja.exe " in directory "C:\_Dev\Projects\eti2si\Repos\EmptyCubeMxPrj\VisualGdbEmptyCubeMxPrj\VisualGdbEmptyCubeMxPrj/build/VisualGDB/Debug" on local computer
C:\PROGRA~2\Sysprogs\VISUAL~1/ninja.exe
[1/4] Building C object CMakeFiles/BSP.dir/Core/Src/system_stm32g4xx.c.obj
FAILED: CMakeFiles/BSP.dir/Core/Src/system_stm32g4xx.c.obj
c:\sysgcc\arm-eabi\bin\arm-none-eabi-gcc.exe -DSTM32G474xx -DUSE_HAL_DRIVER -I../../../Core/Inc -I../../../Drivers/STM32G4xx_HAL_Driver/Inc -I../../../Drivers/STM32G4xx_HAL_Driver/Inc/Legacy -I../../../Drivers/CMSIS/Device/ST/STM32G4xx/Include -I../../../Drivers/CMSIS/Include -g3 -O0 -ffunction-sections -fdata-sections -mcpu=cortex-m4 -mfpu=fpv4-sp-d16 -mhard-float -MD -MT CMakeFiles/BSP.dir/Core/Src/system_stm32g4xx.c.obj -MF CMakeFiles\BSP.dir\Core\Src\system_stm32g4xx.c.obj.d -o CMakeFiles/BSP.dir/Core/Src/system_stm32g4xx.c.obj -c ../../../Core/Src/system_stm32g4xx.c
../../../Core/Src/system_stm32g4xx.c: In function 'SystemInit':
../../../Core/Src/system_stm32g4xx.c:181:2: error: #error " Test"
181 | #error " Test"
| ^~~~~
[2/4] Building CXX object CMakeFiles/VisualGdbEmptyCubeMxPrj.dir/main.cpp.obj
FAILED: CMakeFiles/VisualGdbEmptyCubeMxPrj.dir/main.cpp.obj
c:\sysgcc\arm-eabi\bin\arm-none-eabi-g++.exe -DSTM32G474xx -DUSE_HAL_DRIVER -I../../../Core/Inc -I../../../Drivers/STM32G4xx_HAL_Driver/Inc -I../../../Drivers/STM32G4xx_HAL_Driver/Inc/Legacy -I../../../Drivers/CMSIS/Device/ST/STM32G4xx/Include -I../../../Drivers/CMSIS/Include -g3 -O0 -ggdb -fno-exceptions -fno-rtti -ffunction-sections -fdata-sections -mcpu=cortex-m4 -mfpu=fpv4-sp-d16 -mhard-float -MD -MT CMakeFiles/VisualGdbEmptyCubeMxPrj.dir/main.cpp.obj -MF CMakeFiles\VisualGdbEmptyCubeMxPrj.dir\main.cpp.obj.d -o CMakeFiles/VisualGdbEmptyCubeMxPrj.dir/main.cpp.obj -c ../../../main.cpp
../../../main.cpp:93:2: error: #error " Test"
93 | #error " Test"
| ^~~~~
ninja: build stopped: subcommand failed.Result: the -ggdb is only used for the main.cpp.
11. Removing the “Optimized for GDB (-ggdb)” option
Build was successful and both breakpoints are working. (Hint: the #error lines are removed before build.)After adding both #error “Test” lines again following output:
Run "C:\PROGRA~2\Sysprogs\VISUAL~1/ninja.exe " in directory "C:\_Dev\Projects\eti2si\Repos\EmptyCubeMxPrj\VisualGdbEmptyCubeMxPrj\VisualGdbEmptyCubeMxPrj/build/VisualGDB/Debug" on local computer
C:\PROGRA~2\Sysprogs\VISUAL~1/ninja.exe
[1/4] Building C object CMakeFiles/BSP.dir/Core/Src/system_stm32g4xx.c.obj
FAILED: CMakeFiles/BSP.dir/Core/Src/system_stm32g4xx.c.obj
c:\sysgcc\arm-eabi\bin\arm-none-eabi-gcc.exe -DSTM32G474xx -DUSE_HAL_DRIVER -I../../../Core/Inc -I../../../Drivers/STM32G4xx_HAL_Driver/Inc -I../../../Drivers/STM32G4xx_HAL_Driver/Inc/Legacy -I../../../Drivers/CMSIS/Device/ST/STM32G4xx/Include -I../../../Drivers/CMSIS/Include -g3 -O0 -ffunction-sections -fdata-sections -mcpu=cortex-m4 -mfpu=fpv4-sp-d16 -mhard-float -MD -MT CMakeFiles/BSP.dir/Core/Src/system_stm32g4xx.c.obj -MF CMakeFiles\BSP.dir\Core\Src\system_stm32g4xx.c.obj.d -o CMakeFiles/BSP.dir/Core/Src/system_stm32g4xx.c.obj -c ../../../Core/Src/system_stm32g4xx.c
../../../Core/Src/system_stm32g4xx.c: In function 'SystemInit':
../../../Core/Src/system_stm32g4xx.c:181:2: error: #error " Test"
181 | #error " Test"
| ^~~~~
[2/4] Building CXX object CMakeFiles/VisualGdbEmptyCubeMxPrj.dir/main.cpp.obj
FAILED: CMakeFiles/VisualGdbEmptyCubeMxPrj.dir/main.cpp.obj
c:\sysgcc\arm-eabi\bin\arm-none-eabi-g++.exe -DSTM32G474xx -DUSE_HAL_DRIVER -I../../../Core/Inc -I../../../Drivers/STM32G4xx_HAL_Driver/Inc -I../../../Drivers/STM32G4xx_HAL_Driver/Inc/Legacy -I../../../Drivers/CMSIS/Device/ST/STM32G4xx/Include -I../../../Drivers/CMSIS/Include -g3 -O0 -fno-exceptions -fno-rtti -ffunction-sections -fdata-sections -mcpu=cortex-m4 -mfpu=fpv4-sp-d16 -mhard-float -MD -MT CMakeFiles/VisualGdbEmptyCubeMxPrj.dir/main.cpp.obj -MF CMakeFiles\VisualGdbEmptyCubeMxPrj.dir\main.cpp.obj.d -o CMakeFiles/VisualGdbEmptyCubeMxPrj.dir/main.cpp.obj -c ../../../main.cpp
../../../main.cpp:93:2: error: #error " Test"
93 | #error " Test"
| ^~~~~
ninja: build stopped: subcommand failed.Now the option -gddb is not used but all breakpoints are working.
Conclusion:
It seems that there are two different issues active:
1. The name of the configuration is used to change debugging parameter
2. The option -gddb is not used for the CubeMx Files or for plain c files.I hope you can follow my description above and find a solution to give the configurations names without changing the settings.
Best regards Timo
-
This reply was modified 3 years, 11 months ago by
Timo Engelmann.
Attachments:
You must be logged in to view attached files.ParticipantHi,
now I have checked the issue with a new empty CubeMx project.
Following results:1. Setup
Creation of a fresh CubeMx CMake project.
Build was successful and breakpoint in system_stm32g4xx.c and in main.c was stopping the execution -> perfect!
Hint: the field “Project Property Pages / C/C++ / General / Debug Information Format” was empty and was not changed.
2. main.cpp
Excluding the original main.c file from build and added a copy of this file in an other folder and renamed it to main.cpp
Build was successful and breakpoint in system_stm32g4xx.c and in main.cpp was stopping the execution -> perfect!
Hint: the field “Project Property Pages / C/C++ / General / Debug Information Format” was still empty.
See attached image: 01.jpg3. Change Configuration name
The name of the “Debug” configuration in “Manage Platforms and Configurations” dialog changed to “Renamed”.
See attached image: 03.jpg4. Build again and start Debugging
Build was successful but now both breakpoints are not available.
See attached image: 05.jpg5. Try to use the “Diagnose…” button
No success in “Reload Symbols” at the Diagnose dialog.
See attached image: 07.jpgPlease see the next post, because only 4 images are possible here….
Attachments:
You must be logged in to view attached files.ParticipantTwo further questions regarding the FastSemihosting:
1. Can you provide an additional function to use the FastSemihosting output without using printf() in one of the future VisualGDB versions ?
This would be great. A simple output of a const string is enough.2. Can you check the int _isatty(int file) in syscalls.c at a Stm32CubeMx project?
In the generated code this function don’t have the __attribute__((weak)).
I have added this weak attribute, or is there a better solution?
Is it possible to fix this automatically during the creation of a VisuaGDB STM32CubeMx project?
Or to add this information into the tutorial: https://visualgdb.com/tutorials/arm/semihosting/ParticipantThanks for the fast and high quality answer.
I will ignore it. As I wrote before, I just need one solution for the debug information output.
And now I have learned many things and every day with learning is a good day 🙂I will use the FastSemihosting as it offers more possibilities for me.
But maybe someone observes the same problem and is happy to get a hint here that both methods should not be used at the same time.Thanks & regards,
Timo-
This reply was modified 4 years, 4 months ago by
ParticipantHi SysProgs Support,
thanks for the answer. I have reduced the project so I can say that I have no code that manipulates the memory.
There is only the following test code in the project, besides the CubeMx and FreeRTOs stuff, but I commented out the FreeRTOS code, so it shouldn’t do anything.for (;;) { dbgCnt++; printf("%d\r\n", dbgCnt); ITM_SendChar('X'); HAL_Delay(100); }If I comment out the ITM_SendChar line, the printf via FastSemihosting runs forever (see screenshot “only_fast_semihosting.jpg”).
But with this line the output of the FastSemihosting printf stucks after 80 up to 300 cycles.
It seems, that the SWO output interfere with the FastSemihosting. Maybe on the the Segger J-Link debugger side?This is not a really problem for me, because I need only one mechanism of this both. But maybe there is a hidden bug inside and therefore I notice this here.
You can see the behavior on the following videos:
- SWO together with FastSemihosting: https://www.youtube.com/watch?v=58WQgLtonC0
- Only FastSemihosting: https://www.youtube.com/watch?v=i3H_soWOq3M
Sometimes the cursor in the VisualGDB Output windows shows a little crazy behavior. It moves synchronous to the output in the localhost window.
You can see this here: https://www.youtube.com/watch?v=VYm8lVtoF5QIf you need it, you can download the project here:
http://tech-engineering.de/transfer/sysprogs/firmware_dbgout_test.zipThe test code can you find in cpp_main.cpp in the 04_BSP folder (see screenshot “cpp_main.jpg”).
Best wishes Timo
-
This reply was modified 4 years, 4 months ago by
Attachments:
You must be logged in to view attached files.ParticipantI have to turn back…
The system don’t stuck completely. Maybe I don’t have update the system after switching to “Discard further data”But the FastSemihosting output is not filled with new data. So, the read is not flushing the old data.
-
This reply was modified 4 years, 4 months ago by
ParticipantOk, unfortunately I observe a problem with the FastSemihosting on my system.
If have set up the FastSemihosting like in the screenshot
https://sysprogs.com/w/wp-content/uploads/2022/03/FastSemihosting_stucks_03.jpg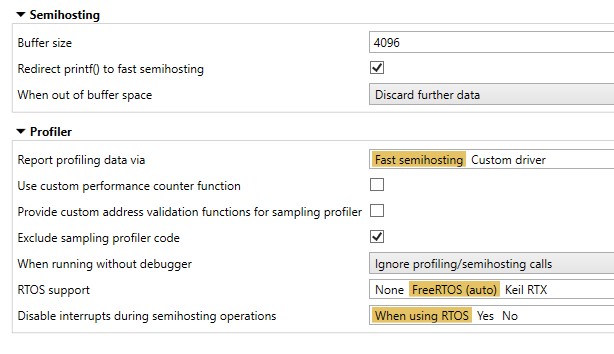
My testcode:
/* USER CODE END Header_StartDefaultTask */
void StartDefaultTask(void *argument)
{
  /* USER CODE BEGIN StartDefaultTask */
    /* Infinite loop */
    for (;;)
    {
        HAL_GPIO_WritePin(Dbg0_GPIO_Port, Dbg0_Pin, GPIO_PIN_SET);
        ITM_Write("SWO\r\n");
        HAL_GPIO_WritePin(Dbg0_GPIO_Port, Dbg0_Pin, GPIO_PIN_RESET);

        HAL_GPIO_WritePin(Dbg0_GPIO_Port, Dbg0_Pin, GPIO_PIN_SET);
        printf("Sem\r\n");
        HAL_GPIO_WritePin(Dbg0_GPIO_Port, Dbg0_Pin, GPIO_PIN_RESET);

        HAL_GPIO_TogglePin(LedCan1_GPIO_Port, LedCan1_Pin);
        HAL_Delay(500);
After some time, the system is stucks.
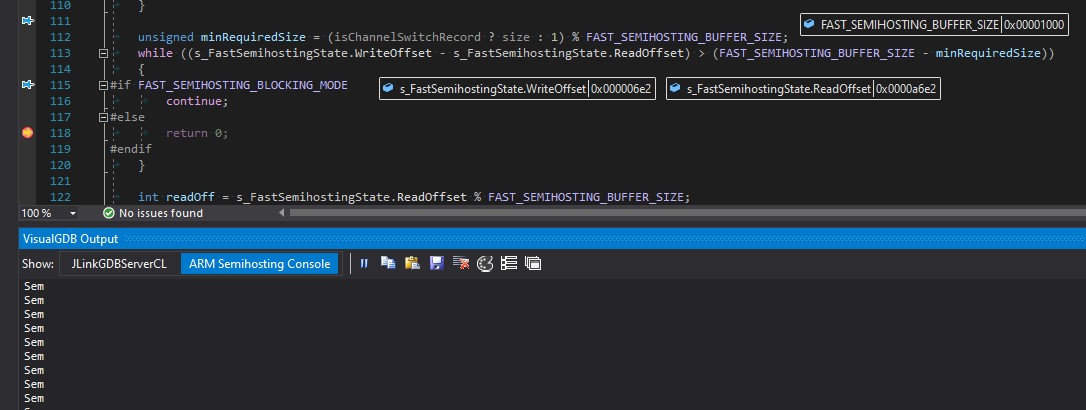
A little bit debugging session shows, that the FastSemihosting buffer check in line 113 in file FastSemihosting.cpp fires.
To check this deeper and give you a better view on the issue I have set a breakpoint at line 118
and after the first stop after system start and waiting some seconds the values are as shown as in the screenshot
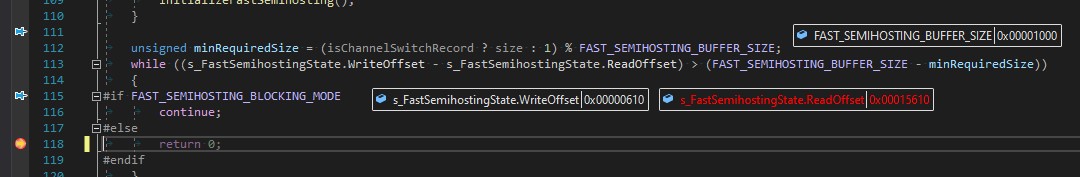
After a click on Continue the system stops again at this breakpoint, but now with different value for ReadOffset:
If I step over I will land at line 246 in file FastSemihosting.cpp as shown in screenshot
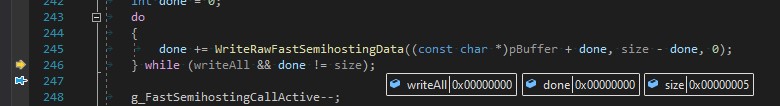
And it will never leave this do-while. Here we are in a endless loop.Questions:
1. How is the buffer emptied and read out? Do I have a wrong setting here? But I can see the output in the window, so I think reading should be ok.
2. Is my round time to fast for the buffer? I have only one endless loop, but with a HAL_Delay(500); – this should be enough time or? Or is it a problem and I have to use the RTOS delay instead?
3. The setting “Discard further data” should prevent a stucking or?-
This reply was modified 4 years, 4 months ago by
-
This reply was modified 4 years, 4 months ago by
Attachments:
You must be logged in to view attached files.ParticipantOnly for testing I call now direct the WriteToFastSemihostingChannel() methode with following result:
HAL_GPIO_WritePin(Dbg0_GPIO_Port, Dbg0_Pin, GPIO_PIN_SET); // From here...
ITM_Write("SWO\r\n");
HAL_GPIO_WritePin(Dbg0_GPIO_Port, Dbg0_Pin, GPIO_PIN_RESET); // ... to here it takes 2.775 µs

HAL_GPIO_WritePin(Dbg0_GPIO_Port, Dbg0_Pin, GPIO_PIN_SET); // From here...
printf("Sem\r\n");
HAL_GPIO_WritePin(Dbg0_GPIO_Port, Dbg0_Pin, GPIO_PIN_RESET); // ... to here it takes 12.525 µs

HAL_GPIO_WritePin(Dbg0_GPIO_Port, Dbg0_Pin, GPIO_PIN_SET); // From here...
WriteToFastSemihostingChannel(1, "Dir\r\n", 5, 1);
HAL_GPIO_WritePin(Dbg0_GPIO_Port, Dbg0_Pin, GPIO_PIN_RESET); // ... to here it takes 2.985 µs
If it is ok to use this method direct, it would be a good result.
It is a little bit slower than the SWO, but I can use the colors if I needed.Is there a problem to use it direct? Maybe regarding calls from different threads?
- Long content is not fully displayed. If the comment is longer than approximately 18 lines, the additional lines are not displayed via IntelliSense.
-
AuthorPosts