Sysprogs forums › Forums › VisualGDB › STM32 SWO vs FastSemihosting
- This topic has 11 replies, 2 voices, and was last updated 4 years, 4 months ago by
support.
-
AuthorPosts
-
March 15, 2022 at 16:53 #32402
Timo Engelmann
ParticipantHi SysProgs Support,
thanks for the support at https://sysprogs.com/w/forums/topic/stm32-itm-swo-solved/ topic.
Now I test the VisualGDB FastSemihosting contra ITM/SWO.I’m using a STM32CubeMx CMake project with FreeRTOS.
My system runs on a STM32G474 with SYSCLK = 160 MHz.
The SWO is clocked at the maximum speed of 40 MHz.To compare the both output methods I use the following simple test code
and measure the diff time at the Dbg0-Pin with a logic analyzer.HAL_GPIO_WritePin(Dbg0_GPIO_Port, Dbg0_Pin, GPIO_PIN_SET); // From here... ITM_Write("SWO\r\n"); // Write direct to SWO. HAL_GPIO_WritePin(Dbg0_GPIO_Port, Dbg0_Pin, GPIO_PIN_RESET); // ... to here it takes 2.775 µs HAL_GPIO_WritePin(Dbg0_GPIO_Port, Dbg0_Pin, GPIO_PIN_SET); // From here... printf("Sem\r\n"); // Print via FastSemihosting HAL_GPIO_WritePin(Dbg0_GPIO_Port, Dbg0_Pin, GPIO_PIN_RESET); // ... to here it takes 12.525 µsFor the result see comments or the attached screenshot.
I assume, that the slower speed of FastSemihosting is caused by using the printf() method.At FastSemihosting.h you write:
//! Do not call directly. Enable the <b>Redirect printf() to fast semihosting</b> option instead and use regular printf().
int WriteToFastSemihostingChannel(unsigned char channel, const void *pBuffer, int size, int writeAll);
Is there any way to write a string directly to FastSemihosting without the comfort of printf()?
Thanks for support!
Timo-
This topic was modified 4 years, 4 months ago by
Timo Engelmann.
Attachments:
You must be logged in to view attached files.March 15, 2022 at 17:18 #32405ParticipantOnly for testing I call now direct the WriteToFastSemihostingChannel() methode with following result:
HAL_GPIO_WritePin(Dbg0_GPIO_Port, Dbg0_Pin, GPIO_PIN_SET); // From here...
ITM_Write("SWO\r\n");
HAL_GPIO_WritePin(Dbg0_GPIO_Port, Dbg0_Pin, GPIO_PIN_RESET); // ... to here it takes 2.775 µs

HAL_GPIO_WritePin(Dbg0_GPIO_Port, Dbg0_Pin, GPIO_PIN_SET); // From here...
printf("Sem\r\n");
HAL_GPIO_WritePin(Dbg0_GPIO_Port, Dbg0_Pin, GPIO_PIN_RESET); // ... to here it takes 12.525 µs

HAL_GPIO_WritePin(Dbg0_GPIO_Port, Dbg0_Pin, GPIO_PIN_SET); // From here...
WriteToFastSemihostingChannel(1, "Dir\r\n", 5, 1);
HAL_GPIO_WritePin(Dbg0_GPIO_Port, Dbg0_Pin, GPIO_PIN_RESET); // ... to here it takes 2.985 µs
If it is ok to use this method direct, it would be a good result.
It is a little bit slower than the SWO, but I can use the colors if I needed.Is there a problem to use it direct? Maybe regarding calls from different threads?
March 15, 2022 at 17:54 #32408support
KeymasterHi,
The fast semihosting pays off when using larger payloads (e.g. outputting large logs to the resource manager). It will also be somewhat faster if you switch to the release build, as the optimizer will eliminate a lot of unnecessary instructions.
The extra delay compared to ITM comes from the logic used for combining multiple output streams (profiler, live coverage, test resources, printf) and is optimized for real-world scenarios (moderate to heavy data flow). We never optimized it for synthetic tests on smaller payloads, so it may indeed be slower than ITM (although still much faster than one can read).
March 15, 2022 at 18:00 #32409ParticipantOk, unfortunately I observe a problem with the FastSemihosting on my system.
If have set up the FastSemihosting like in the screenshot
https://sysprogs.com/w/wp-content/uploads/2022/03/FastSemihosting_stucks_03.jpg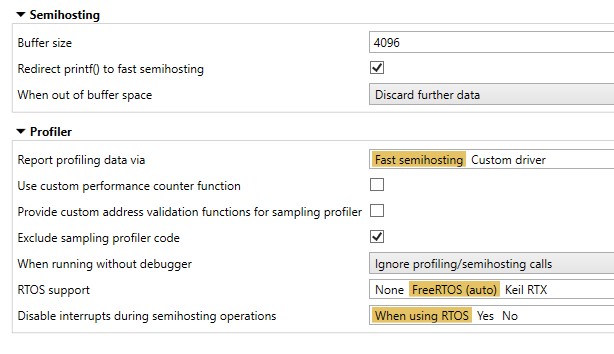
My testcode:
/* USER CODE END Header_StartDefaultTask */
void StartDefaultTask(void *argument)
{
  /* USER CODE BEGIN StartDefaultTask */
    /* Infinite loop */
    for (;;)
    {
        HAL_GPIO_WritePin(Dbg0_GPIO_Port, Dbg0_Pin, GPIO_PIN_SET);
        ITM_Write("SWO\r\n");
        HAL_GPIO_WritePin(Dbg0_GPIO_Port, Dbg0_Pin, GPIO_PIN_RESET);

        HAL_GPIO_WritePin(Dbg0_GPIO_Port, Dbg0_Pin, GPIO_PIN_SET);
        printf("Sem\r\n");
        HAL_GPIO_WritePin(Dbg0_GPIO_Port, Dbg0_Pin, GPIO_PIN_RESET);

        HAL_GPIO_TogglePin(LedCan1_GPIO_Port, LedCan1_Pin);
        HAL_Delay(500);
After some time, the system is stucks.
A little bit debugging session shows, that the FastSemihosting buffer check in line 113 in file FastSemihosting.cpp fires.
To check this deeper and give you a better view on the issue I have set a breakpoint at line 118
and after the first stop after system start and waiting some seconds the values are as shown as in the screenshot
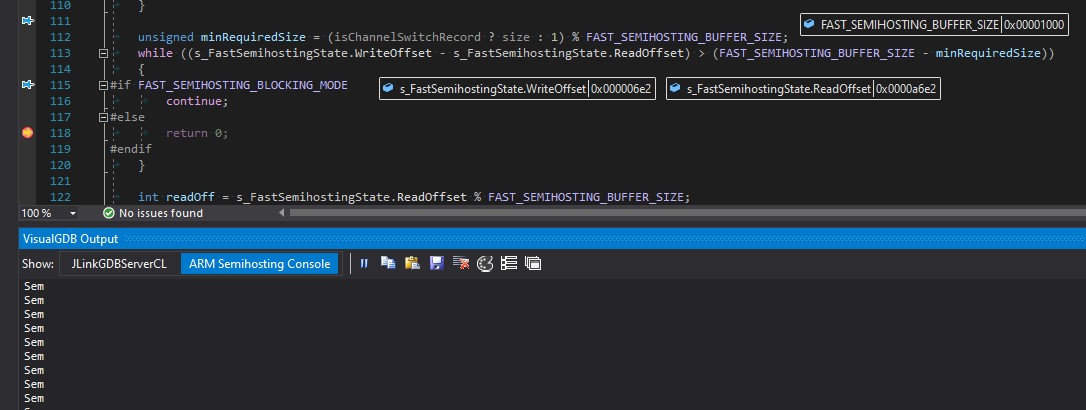
After a click on Continue the system stops again at this breakpoint, but now with different value for ReadOffset:
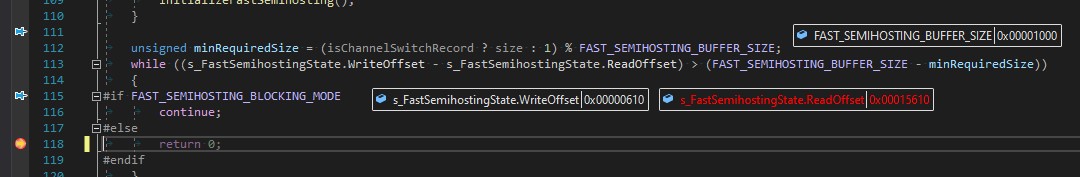
If I step over I will land at line 246 in file FastSemihosting.cpp as shown in screenshot
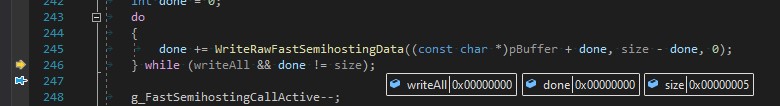
And it will never leave this do-while. Here we are in a endless loop.Questions:
1. How is the buffer emptied and read out? Do I have a wrong setting here? But I can see the output in the window, so I think reading should be ok.
2. Is my round time to fast for the buffer? I have only one endless loop, but with a HAL_Delay(500); – this should be enough time or? Or is it a problem and I have to use the RTOS delay instead?
3. The setting “Discard further data” should prevent a stucking or?-
This reply was modified 4 years, 4 months ago by
-
This reply was modified 4 years, 4 months ago by
Attachments:
You must be logged in to view attached files.March 15, 2022 at 18:19 #32417ParticipantI have to turn back…
The system don’t stuck completely. Maybe I don’t have update the system after switching to “Discard further data”But the FastSemihosting output is not filled with new data. So, the read is not flushing the old data.
-
This reply was modified 4 years, 4 months ago by
March 17, 2022 at 18:57 #32424KeymasterHi,
No problem, please find the answers below:
- The buffer is emptied and read out by VisualGDB via the background memory reading commands (e.g. mdw in OpenOCD).
- Fast round time should not be a problem. The framework can automatically pause and wait for VisualGDB to read out the data.
- The “discard further data” setting is useful if the target is producing the data faster than the JTAG debugger can read it.
In general, the issue you are describing looks like a memory corruption somewhere in the project. Under normal circumstances, ReadOffset should always be less or equal to WriteOffset. If this is not the case, something else in the code likely sets one of these fields to an incorrect value, preventing further semihosting operation.
March 18, 2022 at 07:17 #32426ParticipantHi SysProgs Support,
thanks for the answer. I have reduced the project so I can say that I have no code that manipulates the memory.
There is only the following test code in the project, besides the CubeMx and FreeRTOs stuff, but I commented out the FreeRTOS code, so it shouldn’t do anything.for (;;) { dbgCnt++; printf("%d\r\n", dbgCnt); ITM_SendChar('X'); HAL_Delay(100); }If I comment out the ITM_SendChar line, the printf via FastSemihosting runs forever (see screenshot “only_fast_semihosting.jpg”).
But with this line the output of the FastSemihosting printf stucks after 80 up to 300 cycles.
It seems, that the SWO output interfere with the FastSemihosting. Maybe on the the Segger J-Link debugger side?This is not a really problem for me, because I need only one mechanism of this both. But maybe there is a hidden bug inside and therefore I notice this here.
You can see the behavior on the following videos:
- SWO together with FastSemihosting: https://www.youtube.com/watch?v=58WQgLtonC0
- Only FastSemihosting: https://www.youtube.com/watch?v=i3H_soWOq3M
Sometimes the cursor in the VisualGDB Output windows shows a little crazy behavior. It moves synchronous to the output in the localhost window.
You can see this here: https://www.youtube.com/watch?v=VYm8lVtoF5QIf you need it, you can download the project here:
http://tech-engineering.de/transfer/sysprogs/firmware_dbgout_test.zipThe test code can you find in cpp_main.cpp in the 04_BSP folder (see screenshot “cpp_main.jpg”).
Best wishes Timo
-
This reply was modified 4 years, 4 months ago by
Attachments:
You must be logged in to view attached files.March 18, 2022 at 08:37 #32430KeymasterHi Timo,
Thanks for narrowing it down. Indeed, we have never tested out the ITM simultaneously with the semihosting. The two interfaces rely on completely different mechanisms, so they should normally not interfere with each other. However, there could be secondary factors interfering with the memory reads.
The most likely model of what is going on is below:
- The profiler framework sets WriteOffset to a correct value
- The profiler framework proceeds to output a character via ITM
- Simultaneously with #2, VisualGDB tries to read WriteOffset and gets a larger value than it actually is
- VisualGDB updates ReadOffset to match the unexpectedly high value
- VisualGDB reads WriteOffset again, that is now permanently lower than ReadOffset and interprets it as a “no new data” condition.
We are somewhat reluctant to trying to reproduce it on our side, because such issues are often caused by environment-specific factors (e.g. SWD crosstalk, power, timing of a specific chip, or bug in a specific hardware revision of J-Link). If it doesn’t affect your regular workflow, we would advise just ignoring it. Alternatively, we can share the instructions to log the interaction between the profiler framework and VisualGDB, that will allow narrowing down the specific incorrect value, but it won’t explain what is causing it.
Another quicker test would be to run a program that increases a global counter and calls ITM_SendChar() in a loop. Then, you can try plotting it with Live Watch and look for irregularities. If some interference between ITM and memory reads exists, it should eventually show up here as well.
The cursor behavior is a known bug caused by the interaction between WPF, WinForms, and the Win32 caret API (VisualGDB ends up rendering the cursor on top of the wrong window due to the timing of the window activation events). It sometimes occurs when having multiple console windows visible at the same time, and usually settles when you start interacting with one of the windows. Other than for the cosmetic effect, it is completely harmless and won’t cause any data loss.
March 18, 2022 at 08:50 #32432ParticipantThanks for the fast and high quality answer.
I will ignore it. As I wrote before, I just need one solution for the debug information output.
And now I have learned many things and every day with learning is a good day 🙂I will use the FastSemihosting as it offers more possibilities for me.
But maybe someone observes the same problem and is happy to get a hint here that both methods should not be used at the same time.Thanks & regards,
Timo-
This reply was modified 4 years, 4 months ago by
March 18, 2022 at 09:17 #32434KeymasterNo problem. If you ever get more weird behavior with ITM, feel free to try the live watch with counter test – it should reveal memory reading problems fairly fast.
Also, feel free to check out the Test Resource Manager. It may prove useful for complex setups (e.g. you can write multiple binary log files and analyze them programmatically later).
March 18, 2022 at 12:21 #32435ParticipantTwo further questions regarding the FastSemihosting:
1. Can you provide an additional function to use the FastSemihosting output without using printf() in one of the future VisualGDB versions ?
This would be great. A simple output of a const string is enough.2. Can you check the int _isatty(int file) in syscalls.c at a Stm32CubeMx project?
In the generated code this function don’t have the __attribute__((weak)).
I have added this weak attribute, or is there a better solution?
Is it possible to fix this automatically during the creation of a VisuaGDB STM32CubeMx project?
Or to add this information into the tutorial: https://visualgdb.com/tutorials/arm/semihosting/March 19, 2022 at 07:13 #32439KeymasterHi,
The standard C library provides a few functions faster than printf(). They all work via the same backend provided by the fast semihosting. You can get a good overview by setting a breakpoint at WriteToFastSemihostingChannel(), calling printf(), checking the call stack involved in the call, and manually calling some of the lower-level functions shown in that call stack. Using puts() could be another option.
Regarding STM32CubeMX, its output usually varies a lot between different versions (and is often buggy), so we try to steer clear of adjusting anything automatically to avoid breaking it even further. Patching it manually could be a reasonable workaround (just make sure you check in the generated files into source control). Another option would be to use the “Exclude from build” command in Solution Explorer to ignore the entire file.
-
This topic was modified 4 years, 4 months ago by
-
AuthorPosts
- You must be logged in to reply to this topic.