Forum Replies Created
-
AuthorPosts
-
support
KeymasterHi,
This is correct. The chronometer relies on the DWT_CYCCNT register, that is only available on ARM Cortex cores.
The Xtensa cores have a similar register called CYCCNT, so you can try copying the %VISUALGDB_DIR%\DWT.xml file under a new name and changing it to use the Xtensa CYCCNT address, but we have not tested it on our side and cannot guarantee that it will work.
KeymasterHi,
A reasonable strategy would be to get it working outside VisualGDB first (e.g. with PuTTY), make sure it works the way you expect it, and then describe your setup so that we could help you replicate something similar in VisualGDB.
KeymasterThanks for verifying your license. This problem would normally be caused by a bug in the .Net image rendering logic that is triggered by some color profiles, although we have fixed it in the latest 6.0 branch.
You can try reverting to the default color profile via Windows Color Management -> Advanced -> Device Profile = System Default.
If it doesn’t help, please try creating a new project selecting the “full-custom” debug mode in the wizard. Does it show the Debug Settings page correctly? If yes, does switching to OpenOCD immediately show an exception?
KeymasterStrange. Could you please share a screenshot of the Help->About VisualGDB window?
KeymasterThanks, we have fixed it on our side and will include the fix in the upcoming VisualGDB 6.0 Beta 3.
If you do not want to wait, you can patch it on your side in the %VISUALGDB_DIR%\MSBuild\PropertyPages\armclang\compiler.xml file.
KeymasterHi,
This behavior was added because the recent versions of the ARMClang toolchain have deprecated the armasm executable, recommending to build them with armclang instead.
You can always restore the old behavior via VS Project Properties -> Configuration Properties -> Keil Settings -> General => Build assembly files with the C compiler = false.
KeymasterHi,
These options should not affect the compiled program. The exact -MD -MP -MF <dep file> combination tells the compiler to produce a dependency file (.dep) for tracking the headers used by this source file (so that VisualGDB would know which files to rebuild if a header changes). If you omit the -MF option, the compiler will try to automatically derive the dependency file name from the object name (which could be different between different compiler types/versions), so VisualGDB uses it to explicitly tell where the dependency file should be created.
The -MP option adds extra Make targets for the header files themselves. They are not directly used by VisualGDB, but they won’t affect the code produced by the compiler either.
You can read more about these options in the GCC documentation. Clang/ARMClang reuses the same syntax.
That said, if you can confirm that changing these options does change the actual code produced by ARMClang, we can gladly investigate it further.
KeymasterHi,
Based on what you described, including a specific header file from your project into a CPPUtest project results in a build error. VisualGDB doesn’t crash or do anything unexpected – it reports the build error as it is supposed to.
In general, VisualGDB cannot automatically fix errors in the code, or automatically make different libraries compatible. It’s up to the user to make sure the code they are trying to build does not contain errors, and that different pieces they are trying to put together are compatible.
You can try exporting the build command line used by VisualGDB into a batch file as shown here and building it manually. Once you reproduce the same build error, you can troubleshoot it just as if it was a regular CMake C++ project not involving VisualGDB.
KeymasterHi,
It’s a part of the project template mechanism, so the GUI for managing it is indeed only available starting from the Custom edition.
That said, the add_bsp_executable() and related commands work with all editions, are fully documented and are expected to remain fully backward-compatible in the future VisualGDB releases. So you can still rely on the VisualGDB’s CMake framework as long as you define the frameworks manually.
KeymasterHi,
It’s hard to say why exactly the command would not be visible. Perhaps, you selected a different project type, or are not using the Custom edition.
If you could attach a screenshot of the entire uncropped Visual Studio window and the context menu with the missing command, we might be able to suggest something.
KeymasterHi,
Based on what we tested, CoPilot works just fine with the Clang IntelliSense engine. It shows a different language type – C/C++ (VisualGDB) instead of just C/C++, but otherwise works the same:
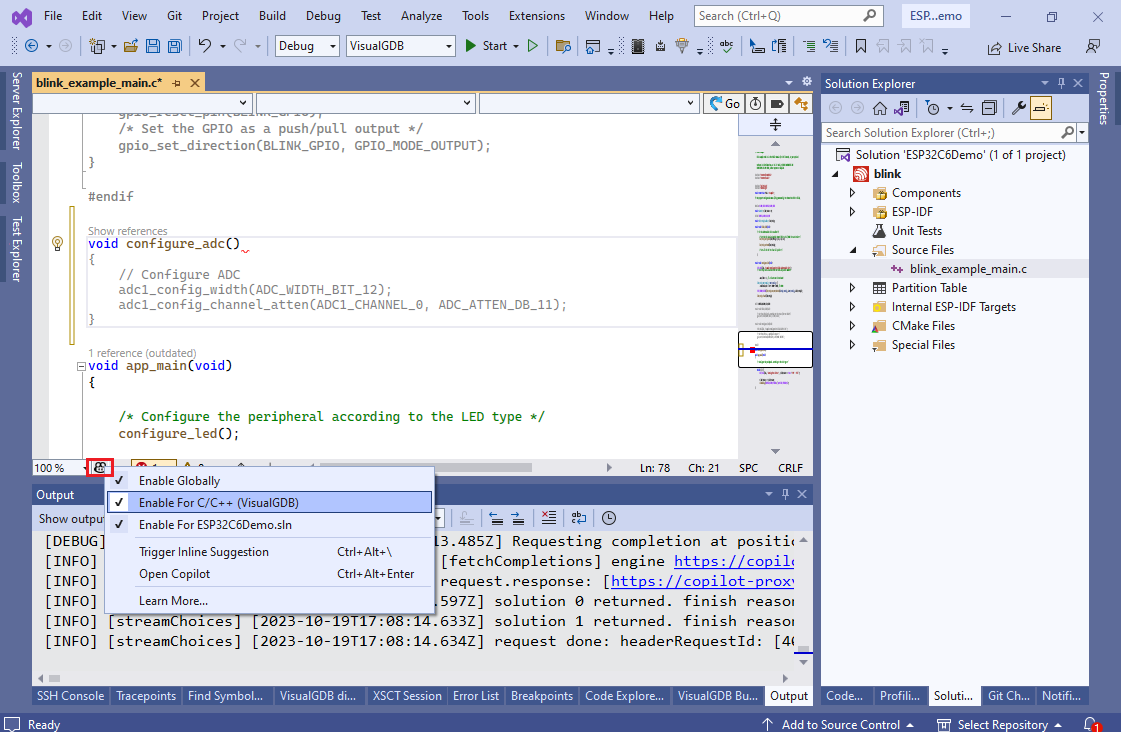
Also it appears to only use the current source file contents for figuring out the completion. You can try creating a new Win32 Console Application, adding the ESP32 source file there, and it will generate the same suggestions regardless of the unresolved headers and other errors. Note that the suggestions are very sensitive to the exact location in the file – generating a body for the same function defined at the beginning, end, or somewhere in the middle yielded completely different results in our tests.
As for why the original C/C++ engine is disabled, it only works with the project types managed by Visual Studio itself (i.e. native VC++). ESP32 projects are managed by VisualGDB – they don’t use the .vcxproj files and instead dynamically show the exact project structure reported by the ESP-IDF build tools. Regular Visual Studio IntelliSense doesn’t know how to work with such dynamic projects, hence we only allow selecting it for the vcxproj-based projects where it can work.
Attachments:
You must be logged in to view attached files.October 15, 2023 at 23:27 in reply to: New Arduino project on esp32 – incorrect mapping only on cpp files #34846KeymasterHi,
It looks like your technical support period has expired. We would be happy to help you, however we would kindly ask you to renew your technical support on the following page first: https://sysprogs.com/splm/mykey
October 15, 2023 at 10:33 in reply to: No rule to make target error with Raspberry Pi toolchain #34840KeymasterHi,
This is a known issue between GCC and GNU Make. Some GCC variants produce the dependency files with “c\:\xxx\yyy” path syntax that breaks GNU Make when it tries to recompute dependencies (hence it only happens on the second build).
The workaround is very easy – simply use CMake with Ninja or MSBuild instead, and it will work just fine.
October 12, 2023 at 08:57 in reply to: cmake not building corretly when used outside of my visualGDB project #34831KeymasterSorry, there is no quick fix. If you would like to port a CMake-based project to run outside VisualGDB, you will have to learn CMake. If you do not wish to do it, just keep using VisualGDB so that it will handle it for you 🙂
KeymasterThis means that at some point some settings in the project were changed to hardcode the toolchain paths, and regenerating the MCU files reset those settings. Without knowing what exact settings were changed, it is not viable to suggest anything meaningful.
-
AuthorPosts