Sysprogs forums › Forums › VisualKernel › SYSRQ Issue
Tagged: mot check, mot checker, mot history
- This topic has 22 replies, 2 voices, and was last updated 3 years, 2 months ago by
support.
-
AuthorPosts
-
May 5, 2023 at 06:23 #34203
MST
Participanthi,
unfortunately I am not allowed to hand out any debug information. But we do not have any modifications to the default kernel code. The error didn’t occur anymore. Maybe it “magically” dissapeared with the recent build (or I make a mistake before ^^).
I still have some issues starting the debugging at the beginning and I don’t really know why it happens. The commands by visual kernel and my commands look exactly the same as far as I can see it in the diagnostics console. Could you maybe add an option that removesthe logging of the “stat” commands. They are really spammy and slow down visual studio due to all the output.
My recipe right now to start the debugging:- Start debugging with “accessible via SSH” –> this will build/copy all files (if required) and start gdb. This usually hangs when gdb tries to connect “-target-select remote /dev/pts/5”.
- Stop debugging, change options to “Crashed/frozen” and restart debugging. In more than 90 % I am able to debug now. From this point on I can also also restart the debugging when the debugee is accessible via SSH (and of course setting this option).
This is a valid solution for me because I can reproduce it more or less all the time (if the machine is not killing itself due to some timeouts in the stopped kernel threads ^^).
May 9, 2023 at 08:46 #34223ParticipantHi,
I tested the tracing some more and it’s a really nice feature. But I had some issues during my tests that I want to let you know:
- The tracing does not work in the “three machine setup”. It seems like the “tracer” is looking for the vmlinux file on the windows pc but tries to use the linux path. You can see the screenshot of the error message in the attachment. I switched to the “two machine setup” for further testing.
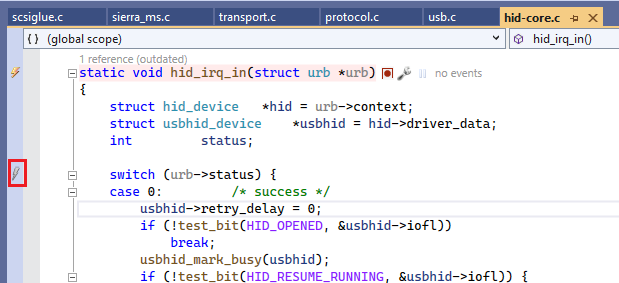
- I tested the debugging with the usbhid driver and stopped the system by pressing a random key and a breakpoint within the “hid_irq_in” function (hid-core.c). I tried to trace the same function but the option to add a trace point to the function (the red dot) is not available (see Tracepoint.png). I checked some more functions in “hid-core.c” and recognized that I can add tracepoints to some functions (e.g. “hid_reset”, “usbhid_mark_busy”, …) but not all of them. Do I have to (somehow) update the database of the traceable functions or what is happening here?
Attachments:
You must be logged in to view attached files.May 9, 2023 at 22:06 #34226support
KeymasterHi,
No problem. If you saw the actual module count in the GUI (not in the debug logs), it was likely trying to build IntelliSense index, rather than the tracepoint index. If it doesn’t happen anymore, it should be safe to ignore.
With the sysrq issues, the only 2 causes we could think of would be timing and SSH command/interactive mode differences. When VisualKernel runs commands over SSH, it uses the special command mode (same as running “ssh user@host <command>” from another Linux machine, but slightly different from running commands directly.
You can try narrowing it down as follows:
- Extract the exact commands used by VisualKernel from the diagnostic log. You can filter out the spammy “stat” commands by using negative grep (grep -v -e “stat” < log1.txt > log2.txt).
- Try running them via ssh from another Linux machine to replicate the SSH command mode used by VisualGDB.
- If it doesn’t reproduce the problem, try renaming the related executables (e.g. /usr/bin/echo => /usr/bin/echo2) and replacing them with wrapper scripts that will introduce ~5 second delays. This should eliminate issues due to timing.
With tracing, please try this build: VisualKernel-4.0.101.2371.msi
It fixes a few issues with the symbol parsing logic that were discovered while testing the 6.x kernel, and might fix the issue you described. If not, could you please check:
- Is the function defined in the kernel itself, or one of the modules? If it is in a module, you would need to add its name to the list of traced modules via VisualKernel Project Properties, or Quick Debug window (requires new build).
- Does the function appear in the list when you click the “new tracepoint” button in the Tracepoints window?
- Can you set tracepoints there via the tracepoint bar (see below)?
We will look into supporting tracing for remote kernels and will publish a hotfix here in a few more days.
Attachments:
You must be logged in to view attached files.May 10, 2023 at 02:10 #34230ParticipantHi,
just a first quick feedback: Tracing the hid_irq_in works with the new build 🙂 I couldn’t set tracepoints via the tracepoint bar before. This also works now and is a very nice feature.
May 10, 2023 at 02:32 #34231Participant(Cannot edit my previous post…)
Ok, I was too quick. I switched back to the previous build (2367) because the “Trace Data” windows is completely empty in your latest build (2371) (at least for me). No data is shown for any event. No options are shown when I try to edit an existing tracepoint. The options bar at the top is also not shown. It’s really an empty window.Furtunately tracing still works in the “old” build via the tracingpoint bar 🙂
May 10, 2023 at 10:16 #34233KeymasterHi,
Oops, sorry about the trace data window glitch. It was a side effect of another last-minute fix. Please try this build: VisualKernel-4.0.101.2372.msi
It also fixes the in-code tracepoint links for inline functions and functions with discontiguous ranges (they were previously traceable via the New Tracpoint button, but not via code).
May 11, 2023 at 02:49 #34234ParticipantHi,
we made a slight update of our kernel version (5.10.174 -> 5.10.175) and now the live tracing fails to build. I tested build 2367 and 2372, both show the same error message:
Run "make -C "/dev/host/kernelsrc/linux-5.10.175" M="/tmp/LinuxKernelDebugHelper-acf78497-911a-4b6b-8f13-53c16f2060bb" modules DISABLE_TRACE_ENGINE=1" in directory "" on local computer

--------------------------

make: Entering directory '/dev/host/kernelsrc/linux-5.10.175'

CC [M]  /tmp/LinuxKernelDebugHelper-acf78497-911a-4b6b-8f13-53c16f2060bb/AppendableBuffer.o

CC [M]  /tmp/LinuxKernelDebugHelper-acf78497-911a-4b6b-8f13-53c16f2060bb/LinuxKernelDebugHelper_main.o

CC [M]  /tmp/LinuxKernelDebugHelper-acf78497-911a-4b6b-8f13-53c16f2060bb/SequentialModuleInfo.o

CC [M]  /tmp/LinuxKernelDebugHelper-acf78497-911a-4b6b-8f13-53c16f2060bb/LiveMemoryEngine.o

CC [M]  /tmp/LinuxKernelDebugHelper-acf78497-911a-4b6b-8f13-53c16f2060bb/TraceEngine.o

make: Leaving directory '/dev/host/kernelsrc/linux-5.10.175'

/tmp/LinuxKernelDebugHelper-acf78497-911a-4b6b-8f13-53c16f2060bb/LiveMemoryEngine.c: In function 'LiveMemoryEngineThread':

/tmp/LinuxKernelDebugHelper-acf78497-911a-4b6b-8f13-53c16f2060bb/LiveMemoryEngine.c:178:11: warning: this 'if' clause does not guard... [-Wmisleading-indentation]

178 |           if (!traceEngine)

|           ^~

/tmp/LinuxKernelDebugHelper-acf78497-911a-4b6b-8f13-53c16f2060bb/LiveMemoryEngine.c:181:5: note: ...this statement, but the latter is misleadingly indented as if it were guarded by the 'if'

181 |     iov.iov_len = TraceEngineProcessMessage(traceEngine, &packet, &remoteAddr, done);

|     ^~~

/tmp/LinuxKernelDebugHelper-acf78497-911a-4b6b-8f13-53c16f2060bb/TraceEngine.c:1171:109: warning: 'struct ftrace_regs' declared inside parameter list will not be visible outside of this definition or declaration

1171 | static notrace void FTraceHookImpl(unsigned long ip, unsigned long parent_ip, struct ftrace_ops *op, struct ftrace_regs *regs)

|                                                                                                             ^~~~~~~~~~~

/tmp/LinuxKernelDebugHelper-acf78497-911a-4b6b-8f13-53c16f2060bb/TraceEngine.c: In function 'ApplyTracepointState':

/tmp/LinuxKernelDebugHelper-acf78497-911a-4b6b-8f13-53c16f2060bb/TraceEngine.c:1253:34: error: assignment to 'ftrace_func_t' {aka 'void (*)(long unsigned int,  long unsigned int,  struct ftrace_ops *, struct pt_regs *)'} from incompatible pointer type 'void (*)(long unsigned int,  long unsigned int,  struct ftrace_ops *, struct ftrace_regs *)' [-Werror=incompatible-pointer-types]

1253 |     tp->AddressBased.FTrace.func = &FTraceHookImpl;

|                                  ^

At top level:

/tmp/LinuxKernelDebugHelper-acf78497-911a-4b6b-8f13-53c16f2060bb/TraceEngine.c:776:44: warning: always_inline function might not be inlinable [-Wattributes]

776 | static bool __attribute__((always_inline)) TraceEngineRollbackWrite(struct TraceTransaction *transaction, size_t size)

|                                            ^~~~~~~~~~~~~~~~~~~~~~~~

/tmp/LinuxKernelDebugHelper-acf78497-911a-4b6b-8f13-53c16f2060bb/TraceEngine.c:763:46: warning: always_inline function might not be inlinable [-Wattributes]

763 | static void * __attribute__((always_inline)) TraceEnginePrepareForWrite(struct TraceTransaction *transaction, size_t size)

|                                              ^~~~~~~~~~~~~~~~~~~~~~~~~~

cc1: some warnings being treated as errors

make[1]: *** [scripts/Makefile.build:286: /tmp/LinuxKernelDebugHelper-acf78497-911a-4b6b-8f13-53c16f2060bb/TraceEngine.o] Error 1

make: *** [Makefile:1826: /tmp/LinuxKernelDebugHelper-acf78497-911a-4b6b-8f13-53c16f2060bb] Error 2

--------------------------

Command exited with code 2
May 11, 2023 at 20:55 #34235KeymasterHi,
This looks like the new kernel has a slightly different configuration (has function tracing API enabled), but is using the older API. Either way, we have updated VisualKernel to handle it correctly: VisualKernel-4.0.101.2374.msi
The new build also fixes the 3-machine issues you described earlier, and improves tracing of inline functions.
-
AuthorPosts
- You must be logged in to reply to this topic.